

See the real Threat Score for your ZIP or county. Local preparedness intelligence from public data — what actually matters where you live.
Joined April 2026
- Tweets93
- Following75
- Followers28
- Likes11




Pinned Tweet
Generic prepping (food, guns, solar) is incomplete. Your county has a unique fingerprint.
We scored every county in America for real preparedness using public data.
Most people are prepping for the wrong threats.
Here’s what actually matters where you live 🧵
Getreadyteam retweeted

A Superfund site is a location in the United States that has been contaminated by dangerous hazardous waste that poses a risk to human health or the environment.
That might be pretty useful to know if you're looking to buy some land. Now part of @getreadyteam's Area Study. Enjoy!
PS. RIP Philly and NJ

We have built a cool feature where you can simulate a solar flare hitting earth. You can adjust the strength of the flare to see how badly your area would be affected. Check it out and let us know what you think


Getreadyteam retweeted

JUST IN: Unknown thief steals every Flock camera in Winona, Minnesota, leaving the city with up to $40,000 in replacement costs.
Spokane Complex Hits 10,280 Acres: Why Neighborhood Fire Maps Can Mislead getready.team/news/weather/2…

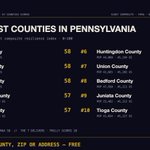
The 10 worst counties in Pennsylvania for preparedness.
Philadelphia: 28/100 — one of the lowest scores in the country. 6.1 million Pennsylvanians live in the bottom 10.
Where does your county rank?

County Fingerprint #012: Bonner County, ID — 50/100.
America's relocation magnet (+12.8/1k net migration, one of the highest anywhere). Low crime, defensible ground.
The catch every new arrival misses: water & food scores 26/100.
Drop your county below and we'll run it. 🧵 3,436 to go.
Sign up today for free to analyze your address getready.team

We ranked all 67 Pennsylvania counties for preparedness.
The T delivers: Fulton, Snyder, and Clarion lead the state.
Philadelphia scores 28/100 — one of the lowest in America. Full ranking free.

County Fingerprint #011: Custer County, ID — 51/100.
0.3 people per km². Freedom score 71. Growing season: 60 days.
The bug-out fantasy county — where freedom isn't free calories. Water & food score: 17.
Drop your county below and we'll run it. 🧵 3,436 to go.
Sign up today for free to analyze your address getready.team

The 10 worst counties in North Carolina for preparedness.
Charlotte posts the state's only CRITICAL rating: 34/100.
Asheville is #98 of 100 — Helene already made this argument.

County Fingerprint #010: Baxter County, AR — 53/100. First rural county in the series.
$810 median rent. Affordability 80/100. Migration +10.6/1k — people are figuring it out.
The Ozarks tradeoff: margin to prep, ice storms to prep for.
Drop your county below and we'll run it. 🧵 3,436 to go.
Sign up today for free to analyze your address getready.team

We ranked all 100 North Carolina counties for preparedness.
While everyone argues mountains vs. coast, the Inner Banks quietly sweep the top 10.
Perquimans County (pop 13,000) leads the state.

County Fingerprint #009: Wake County, NC — 42/100.
Raleigh is what "prepare for interruption, not isolation" looks like: excellent services, 18/100 self-sufficiency.
Stored depth beats land here.
Drop your county below and we'll run it. 🧵 3,436 to go.
Sign up today for free to analyze your address getready.team

We ranked all 56 Montana counties for preparedness.
Plot twist: Bozeman (44) and Missoula (41) rank near the BOTTOM. The Hi-Line quietly wins.
Chouteau County leads at 64/100.

County Fingerprint #008: Travis County, TX — 40/100.
Austin's infrastructure scores 73. Its climate stability: 17, and falling. Tornado + hail lead the threat board.
Great system. Rising hazard load. Plan for both.
Drop your county below and we'll run it. 🧵 3,436 to go.
Sign up today for free to analyze your address getready.team


