

irl architect | virtual degen
Joined April 2024
- Tweets9.8K
- Following1.1K
- Followers966
- Likes62.8K


Pinned Tweet
$BTC
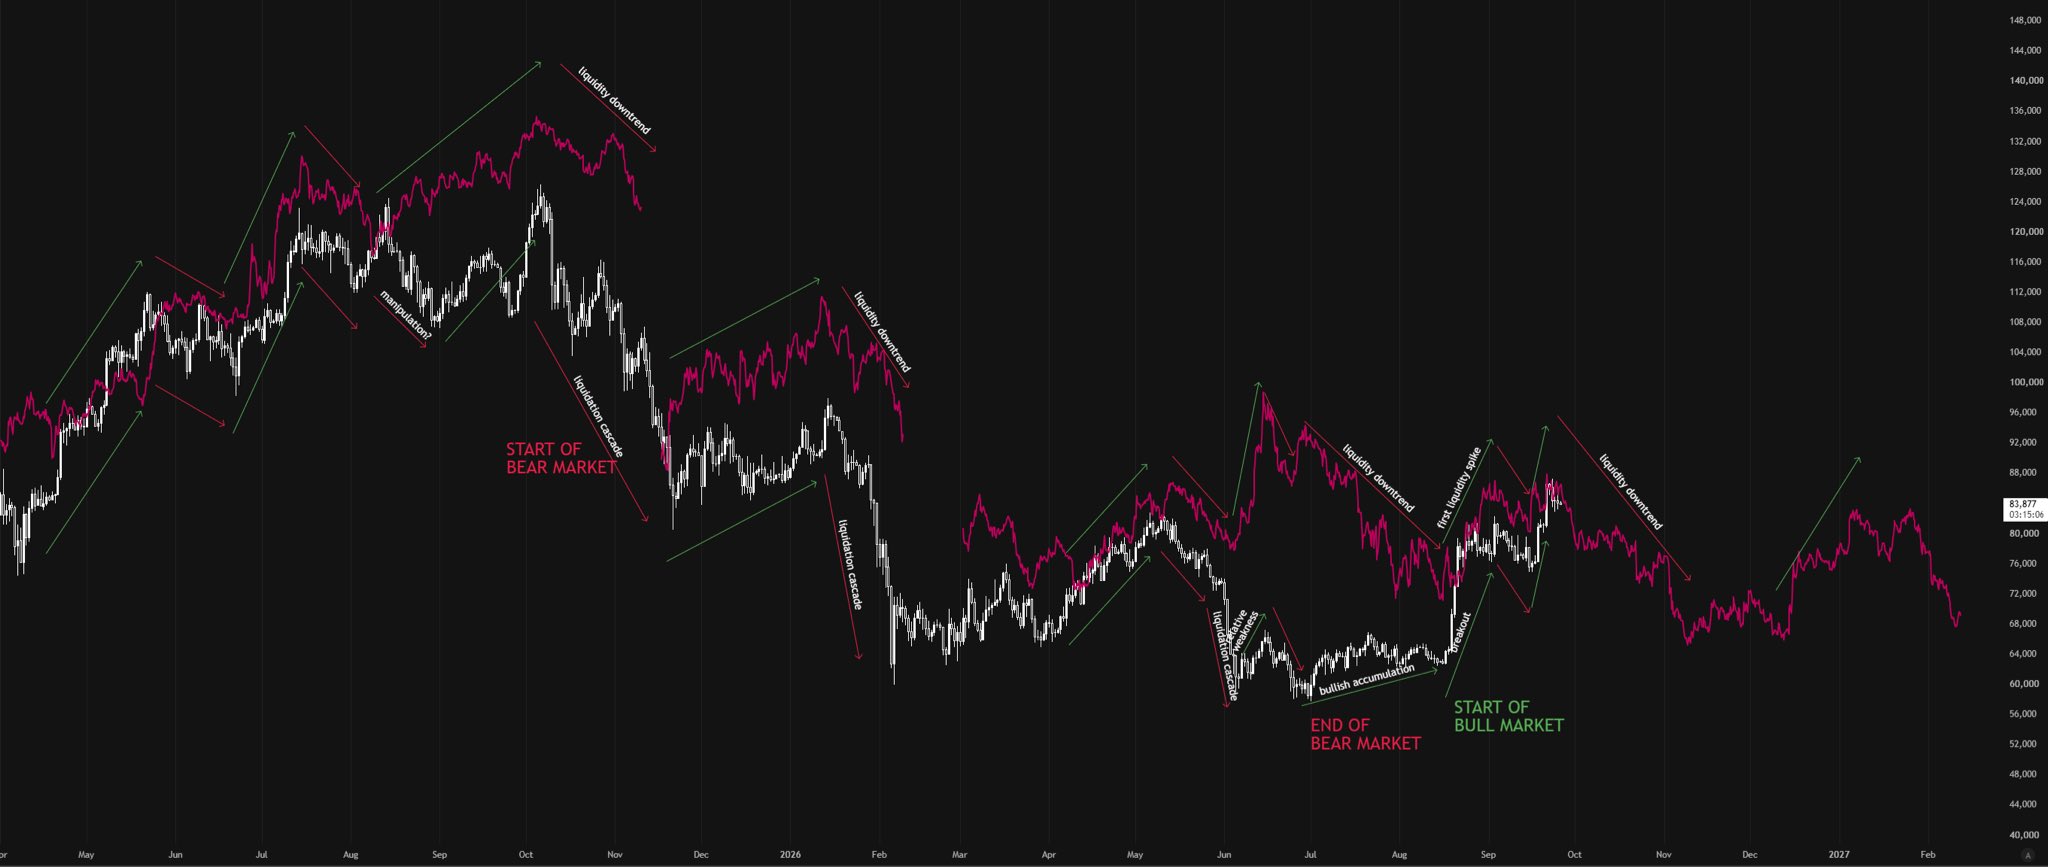
Inverse $DXY (liquidity leading indicator)
In the past, I have spoken about the correlation between all major assets and the DXY
I noticed over a year ago a very strong correlation in the $DXY to the way money flows to assets - with a lag time which can be relatively predictable and repeatable. Using it provided a helpful leading indication of future price action
I call it my crystal ball for a reason
For the first time, I sat down and constructed a comprehensive analysis of the inverse DXY against BTC to see how PA behaved and how it gives clues as to how the next few months may unfold
This is one of the many reasons I think all assets including BTC are due for a pullback
You will need to zoom in to see all the details and notation
$MU
Still have a suspicion that the local bottom isn’t in yet
Perhaps one more stab lower


$MU
Update
PA is following my drawing nicely
Still expecting a rejection from this resistance here and possibly to new lows today or early next week
But if it flips above the line and holds, that would be my sign to close puts and possibly go long

The reckless destruction of beauty and truth is an unthinkable act of evil, a crime of the highest order, like the killing of a thousand innocents. A society that stands idly by as their sacred monuments are destroyed is no longer worthy of the name.

Some of the artwork that burned up last night, completely irreplaceable. xitter.cf/DrewPavlou/status/2111…


$BTC
Inverse DXY update
Following along nicely
Definitely eyeing sub 75k by mid-November

$BTC
Been a while since I updated
Generally speaking the bear thesis for Oct into Nov appears to be playing out
It may not continue aggressively down from here and could instead range, but I think it is less likely that we see an impulsive move to the upside anytime soon
75k is definitely on the table and if enough long liquidity builds up I could definitely see market makers nuking price even further

$SPY
$SPX
My downward target was meant for next week and got blown through today with no meaningful bounce
I don’t think the bottom is in, so need to recalibrate
My best guess is somewhere between mid 750s and mid 740s early to mid next week for a bottom
Still holding puts into Monday close and will assess then

$SPY
Update
Sometimes I even surprise myself with my accuracy
Simple indicators and logical TA based on price action
That said, a dip below 760 to take out the previous low could still happen, I’m just not banking on it


$SPY
Update
Sometimes I even surprise myself with my accuracy
Simple indicators and logical TA based on price action
That said, a dip below 760 to take out the previous low could still happen, I’m just not banking on it
$SPY
Also pushing up into resistance here so I am not able to get bullish yet
Logical to see a rotation back down to low 760s where I will start to look for calls/longs if it holds
SPY continues to show strength so I can’t see it dropping far below 760 unless we get some big news event

$QQQ
We did indeed see the bounce as expected
And bulls have likely piled in around these levels expecting a reversal to new highs but I think it was only a bump on a path lower into next week
Let’s see

$QQQ
If we see a bounce it should be around here
Mostly out of puts now
That said, the market has been conditioned for massive bounces or new highs after pullbacks
So there is a good chance this just speed runs further down to punish patient bears waiting for a bounce and bulls who tried to catch a falling knife

$SPY
Also pushing up into resistance here so I am not able to get bullish yet
Logical to see a rotation back down to low 760s where I will start to look for calls/longs if it holds
SPY continues to show strength so I can’t see it dropping far below 760 unless we get some big news event
$MU
Update
PA is following my drawing nicely
Still expecting a rejection from this resistance here and possibly to new lows today or early next week
But if it flips above the line and holds, that would be my sign to close puts and possibly go long
$MU
Re-entered puts here
Imo we have overhead resistance now at 920-930 and I can’t see bulls being rewarded yet
More liquidity to grab lower down
Targeting low 800s or high 700s for early next week
At the very least a double bottom in the mid 800s

$MU
Re-entered puts here
Imo we have overhead resistance now at 920-930 and I can’t see bulls being rewarded yet
More liquidity to grab lower down
Targeting low 800s or high 700s for early next week
At the very least a double bottom in the mid 800s
$QQQ
If we see a bounce it should be around here
Mostly out of puts now
That said, the market has been conditioned for massive bounces or new highs after pullbacks
So there is a good chance this just speed runs further down to punish patient bears waiting for a bounce and bulls who tried to catch a falling knife
$QQQ
Update
Again tracking a bottom some time between 20-22 October
Given the reaction today it is looking more likely that the entire range as sketched does play out

$MU
Read the replies
The anger and denial is eye opening
The amount of absolute pain that will be felt in a few months as people hold and keep averaging down waiting for a new ATH is palpable
Been there done that
Learned never to repeat
THE CASINO ALWAYS WINS

$MU closing on the lows
For those that added today, know that you will never see a profit on today's purchases

$QQQ
Update
Again tracking a bottom some time between 20-22 October
Given the reaction today it is looking more likely that the entire range as sketched does play out
$QQQ
Sketched this a few days ago. Let’s see if it plays out.
Maybe a bit extremely but at least reverting back to mean (720ish) looks more likely
Methinks October 20-22 is a good spot for a bottom and to start looking for longs/calls


$QQQ
Sketched this a few days ago. Let’s see if it plays out.
Maybe a bit extremely but at least reverting back to mean (720ish) looks more likely
Methinks October 20-22 is a good spot for a bottom and to start looking for longs/calls
$BTC
Been a while since I updated
Generally speaking the bear thesis for Oct into Nov appears to be playing out
It may not continue aggressively down from here and could instead range, but I think it is less likely that we see an impulsive move to the upside anytime soon
75k is definitely on the table and if enough long liquidity builds up I could definitely see market makers nuking price even further
$BTC
Inverse $DXY (liquidity leading indicator)
In the past, I have spoken about the correlation between all major assets and the DXY
I noticed over a year ago a very strong correlation in the $DXY to the way money flows to assets - with a lag time which can be relatively predictable and repeatable. Using it provided a helpful leading indication of future price action
I call it my crystal ball for a reason
For the first time, I sat down and constructed a comprehensive analysis of the inverse DXY against BTC to see how PA behaved and how it gives clues as to how the next few months may unfold
This is one of the many reasons I think all assets including BTC are due for a pullback
You will need to zoom in to see all the details and notation

