

Make America Math Again
Joined February 2026
- Tweets246
- Following21
- Followers21
- Likes3






Pinned Tweet
The American Economic Shift: From Factories to Services
Time travel through nearly 9 decades of economic data to see how the U.S. economy fundamentally rearchitected itself.
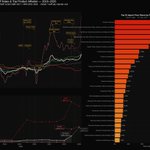
This analysis breaks down the raw historical numbers up to May 2026 to reveal the absolute transformation of the American workforce. We map out every major macroeconomic dataset simultaneously to visualize the structural friction between labor demographics, trade flows, monetary policy, and fiscal realities.
Plotted Data Series Included:
Demographics & Labor Force: U.S. Population (16+), Prime Age (25 to 54) Population Growth, Total Employed, Total Unemployed, and total Employed vs Unemployed Workforce percentages.
Employment Channels: Total Nonfarm Job Growth (Month over Month), alongside individual absolute MoM and Cumulative Job Growth broken down across 11 key sectors.
Trade Dynamics: The U.S. Trade Balance (tracking an $18.0T cumulative deficit), alongside current annualized Tariff Revenue run rates ($346B/yr SAAR) and cumulative historical tariff collections ($2.1T).
Fiscal Counters & Policy Eras: The accelerating trajectory of the U.S. National Debt ($39.2T real baseline) mapped against a structural Counterfactual Debt simulation ($18.7T adjusted line). This is explicitly overlaid with U.S. Presidential administration bands to track historical political shifts.
Monetary Dynamics: The M2 Money Supply ($22T baseline), tracked alongside Federal Reserve Chair tenures to visualize the exact correlation between federal borrowing and money printing.
The data is on the screen. The conclusions are up to you. Watch the timeline, run the math, and leave your thesis in the comments below.
#Macroeconomics #GlobalTrade #EconomicData #NationalDebt #M2MoneySupply #Inflation #Tariffs #FracturedArchitecture
youtu.be/9FQopBAmwdU?si=qEGS… via @YouTube
Fun thought experiment for you all.. Inflation usually acts like a financial cheat code for the ultra wealthy. You borrow cheap money against your assets, let inflation eat the real value of that debt, and buy a bigger yacht.
But what if we patched that exploit and made inflation an absolute nightmare for high net worth leverage? Here are four ways to flip the script:
CPI-Indexed Jumbo Loans: Your massive debt principal automatically grows at the exact same rate as inflation.
Dynamic Margin Requirements: When inflation spikes, regulators force stricter limits on securities-backed loans. Pay up or get liquidated.
Pledged Asset Taxes: Trying to borrow against unrealized gains to avoid taxes? That now triggers an immediate tax bill tied directly to the current CPI.
Mega-Debt Surcharges: Central banks penalize institutions holding massive personal loans, forcing them to pass eye-watering interest rates directly to the borrower.
Here is the fun part: how this actually affects the balance sheet and the broader economy.
Faced with those brutal new rules, highly leveraged individuals would have no choice but to aggressively sell off assets to pay down their loans. That forced, panic-induced liquidation triggers an absolute tsunami of previously deferred capital gains. If the Treasury scoops up that historic wave of tax revenue and points it directly at the deficit, we could watch the balance shrink like a cheap shirt in a hot dryer.
Even better, it breaks the asset bubble cycle. Without the easy money cheat code, capital would have to do something crazy like fund actual productive businesses. We would finally shift away from inflation-based phantom growth and get back to real, fundamental economic growth.
Any bets on how fast national debt would collapse if we actually tried this?
#Economics #NationalDebt #WealthManagement #TaxPolicy #Finance #MonetaryPolicy #MacroEconomics
So Trump got the exact economic reports he needed to drive the completely irrational market up. Nothing to see here.
The market is completely mispricing today's setup, expecting a soft landing without realizing the BEA specifically engineered their methodology revisions this morning to make the PCE print look artificially cool. PCE is only softening because consumer demand is collapsing.
Advance Retail Sales dropped 3.49% and consumer sentiment is deeply depressed at 51.7. At the same time, WTI crude has rebounded above $96, wholesale PPI jumped nearly 1%, and the 10 year Treasury yield is pinned at a restrictive 5.24%.
This locks the Federal Reserve in a classic stagflationary trap. The Fed cannot rescue equities or the consumer with aggressive rate cuts without reigniting energy inflation and blowing out long end yields. Conversely, keeping the policy rate restrictive into an already contracting economy guarantees a credit freeze and accelerates a hard landing. The Fed is structurally paralyzed and cannot provide a liquidity put.
If ADP payrolls come in soft at 8:15 AM ET, it confirms the downturn is accelerating. With market makers holding heavy negative gamma exposure, any initial selling pressure in $QQQ will force aggressive dealer short hedging. Market makers must sell into declining prices to stay neutral, turning routine macro weakness into a cascading liquidity flush across tech.
Reminder to self to redo this video with latest data. But imagine it only getting much worse. xitter.cf/fracturedarch/status/2…


The History of the US Stock Market & Inflation (1790 to 2026) youtu.be/jQAh2jv7EOM?si=k5MJ… via @YouTube
I might redo this video with some additional data. Any suggestions?
This might just be the largest $SPY stock market crash in history about to take place. I’m kinda concerned..
$HTZ is so absurdly undervalued that the market pricing looks like a mathematical glitch. A century-old American icon generating $9 billion in annual revenue is currently sitting at a $665 million market cap. Divide that equity value by their 22,000 employees and it does not even cover half a year of average payroll. Yes, they carry $18 billion in debt, but that debt is asset-backed by physical vehicles, and the brutal hangover from Elon Musk using Hertz as his personal dumping ground is finally in the rearview mirror.
Tesla completely rug-pulled Hertz. Hertz made a visionary bet on the energy transition, only for $TSLA to aggressively slash MSRPs overnight, cratering fleet residual values, spiking repair costs, and inflicting catastrophic book-value destruction. Wall Street algorithms and ambulance-chasing law firms like Pomerantz and Levi & Korsinsky pounced immediately, flooding the wire with class action deadlines to manufacture panic, shake out retail believers, and press their shorts.
They missed one critical reality: you cannot download a rental car.
Hertz commands an irreplaceable physical fortress of prime airport real estate that digital disruptors cannot replicate. While headline readers panic over a manufactured liquidity doom loop, the operational turnaround is already printing. Hertz purged the bad metal, refreshed over 90% of its U.S. fleet with newer models, dropped net monthly depreciation per unit back toward target levels, and swung to a quarterly GAAP profit with multi-year highs in Revenue Per Day. Add in their strategic evolution into autonomous logistics and fleet orchestration for partners like Uber, Lucid, and the new Oro platform, and Hertz is pivoting from a vulnerable hardware owner into an indispensable mobility backbone.
The technical setup is a powder keg. Quantitative options flow and dealer positioning reveal that institutional players are severely overextended on the short side. When heavily shorted, distressed equity collides with undeniable operational survival, the upward repricing is not a slow crawl. It is a violent squeeze that leaves the shorts trapped in the lit book.
They absorbed the absolute worst damage Tesla could inflict and survived. When the dust settles, the asymmetric upside here is massive.
This is just a story about an American icon. Not financial advice.
To be fair. Here is the counterargument.
$HTZ Fundamental Valuation Breakdown
The Financial Inputs (TTM / Q2 2026):
Revenue: $8.91 billion
Operating Income (EBIT): $821.8 million
Cash & Equivalents: $631 million
Total Debt: $18.75 billion
Net Debt: $18.12 billion
The Asset Reality (Cars & Real Estate): A common misconception is that Hertz sits on a massive, unencumbered real estate empire. In reality, rental car companies lease their prime airport lots and neighborhood branches.
Owned Property & Equipment: ~$560 million
Leased Real Estate (Right-of-Use Assets): ~$2.3 billion
Revenue Earning Vehicles (The Fleet): ~$13.7 billion
While $13.7 billion in cars and $560 million in owned real estate sounds massive, these assets are heavily depreciating and financed almost entirely by credit. When you subtract Hertz's $24 billion in total liabilities from its total assets, the company actually has a negative book value (an equity deficit of roughly -$786 million).
The DCF Valuation Mechanics:
With interest coverage below 1.0x and debt comprising 96.3% of total capital, an economically grounded distressed WACC floor of 14.0% applies.
Five Year Present Value of FCFF: $3.21 billion
Terminal Value (discounted at 14.0%, 2.5% terminal growth): $4.57 billion PV
Implied Operating Enterprise Value: $7.78 billion
The Enterprise to Equity Bridge: $7.78 billion Enterprise Value + $0.63 billion Cash minus $18.75 billion Total Debt = negative $10.34 billion Equity Value.
Net debt exceeds the operating enterprise value by more than $10.3 billion. When liabilities surpass the value of the physical asset collateral, the owned real estate, and the future operating cash flows to this degree, common equity is completely underwater.
Intrinsic Value per share: $0.00.
This is not financial advice. Just some calculations on HTZ valuation.
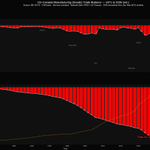
I recently processed the IMF's raw Direction of Trade Statistics back to 1971 to map out the historical US manufacturing balance. Compiling the bilateral flows reveals a massive structural shift, compounding into a cumulative manufacturing deficit of $26.46 trillion as of 2026.
Tracing historical inflection points like the Nixon Shock, NAFTA, and China's WTO entry alongside the compounding stock puts the long-term trajectory into sharp perspective. It is even more sobering when overlaid with the US National Debt hitting $40.1 trillion.

@elonmusk What happens to the national debt if Congress completely bans commercial banks from creating money out of thin air and pegs all commercial loan rates to inflation? The government loses its ability to monetize deficits. Total fiscal discipline, forced instantly.
Wall Street algorithms and predatory law firms are actively trying to bury a century old American icon, but the mechanics of this trade point to a massive structural reversal. The institutional narrative right now is designed to inflict maximum psychological pain and shake out the remaining retail believers. Suits in corner offices are aggressively shorting the tape while ambulance chasing law firms like Pomerantz and Levi & Korsinsky flood the wire with September 22 class action deadlines. They want everyone to believe the catastrophic depreciation of the electric vehicle fleet was a fatal blow. Management took a visionary gamble on the green energy transition, purchasing tens of thousands of EVs to modernize travel, only to be entirely blindsided by unprecedented price slashing from Tesla. $TSLA The resulting book value destruction was brutal, forcing the company to take billions in losses and navigate a highly dilutive financing deal just to secure high interest debt.
But the underlying physical infrastructure of this business remains an absolute fortress. You cannot download a rental car. The institutional trading volume and options flow metrics that typically track systemic distribution are currently masking a massive underlying resilience. While the headline readers panic over a temporary liquidity crunch, the actual operations are quietly generating over eight billion dollars in annual revenue. The physical locations are locked in at every major global airport, and the cars are constantly rented by a public that fundamentally relies on the service. The corporate pivot away from owning depreciating EV hardware toward managing autonomous logistics for innovators like Uber and Lucid is a brilliant strategic evolution. They are transforming from a vulnerable asset owner into an indispensable logistics provider.
The current price action is a mathematically orchestrated illusion. The heavily shorted float and the massive options chain suggest that the major players are severely overextended on the short side. When tracking the options flow, implied volatility, and institutional trading volume through quantitative financial software models, it becomes blatantly obvious that the overhead resistance is purely artificial. The institutional dealers holding those massive put blocks are structurally trapped if a sudden retail volume shock hits the lit book. A massive short squeeze is not just a fantasy; it is a mathematical inevitability when heavily shorted distressed equity collides with undeniable operational survival. When the tide finally turns and the momentum algorithms are forced to cover, the violent upward repricing will absolutely vaporize the institutional short sellers.
$HTZ
This is just a story about an American icon. Not financial advice.
The July jobs report was a disaster (-23K jobs), yet SPY opened green. Why? It is all a mirage built on options market structure. The August 3 to 6 rally was driven by dealer hedging, not fundamentals. Now, we are sitting on a gamma trap. 🧵👇
The GEX-Adjusted Target: With the 1.8x negative gamma amplifier kicking in below $768, a graceful decline turns into a cascade.
Macro Target: $767.57
Gamma-Adjusted Target: $764.42
Watch $768 closely today. If it snaps, the scaffolding collapses.
$SPY
The $768 Tripwire: Our baseline macro model expects a -0.51% drop to $767.57 on the severe jobs miss. That target pierces the $768 Put Wall (1.07M OI). If SPY breaks $768, the gamma flip forces dealers to sell into the decline to hedge their books.
The Fragility of the Rally: Over 52% of all call open interest (2.8M contracts) was swept through during the $750 to $771 melt-up this week. Dealers were forced to buy shares to delta hedge. That mechanical, forced buying is the only reason the market had the scaffolding to rally into this negative jobs print.