

Foresight Analytics is a leading provider of evidenced based investment consulting, data analytics, research and diligence solutions to global investors.
Bella Vista, 2153
Joined October 2015
- Tweets779
- Following1.8K
- Followers356
- Likes712
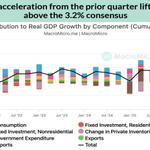

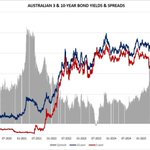


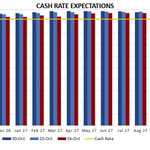
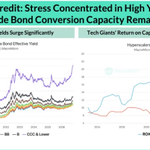


Chart of the week: US Q3 GDP Growth Accelerates to 3.4%, Driven by Resilient Consumer
US economic growth accelerated to an annualised 3.4% in Q3, up from 2.2% in Q2 and exceeding consensus expectations of 3.2%. Year-on-year growth moderated slightly to 2.1% from 2.2%. Consumer spending remained the principal growth driver, expanding 3.8% annualised and contributing approximately 2.5 percentage points to GDP growth. Services expenditure increased 4.1%, led by healthcare, restaurants and accommodation, while goods spending rose 3.0%, supported by both durable and nondurable purchases. Broad-based consumption strength underscores the resilience of the US economy despite prevailing economic uncertainties, suggesting continued support for growth and potentially reducing pressure on the Federal Reserve to ease monetary policy.
Read more - zurl.co/yj0Xj
#USEconomy #USGDP #EconomicGrowth #ConsumerSpending #FederalReserve #FedPolicy #MonetaryPolicy #Macroeconomics #EconomicOutlook #USMarkets #GlobalEconomy #InflationOutlook

10
Weekly Overview of the ETF Markets
Private Credit and Property Lead as Crypto and Precious Metals Retreat
The week ending 30 October 2026 saw private credit, inverse strategies and property lead, while crypto, precious metals and China tech came under pressure. VanEck Global Listed Private Credit (AUD Hedged) ETF (LEND) led all ETFs at +4.2%, alongside Global X Ultra Short Nasdaq 100 Complex ETF (SNAS) and Global X S&P Biotech ETF (CURE) each at +4.2%. Global X US Infrastructure Development ETF (PAVE) rose 3.8%, while property featured prominently, with SPDR S&P/ASX 200 Listed Property Fund (SLF) and Vanguard Australian Property Securities Index ETF (VAP) up 3.8% and 3.7%. Resources also drew support, with SPDR S&P/ASX 200 Resources Fund (OZR) and Betashares S&P/ASX 200 Resources Sector ETF (QRE) each at +3.7%, alongside Betashares Global Royalties ETF (ROYL) at +3.7% and Muzinich BDC Income Fund (BDCI) at +3.3%.
Read more details here - zurl.co/g4gkj
#ASX #ETFs #AustralianETFs #PrivateCredit #PropertyInvesting #FixedIncome #CryptoMarkets #PreciousMetals #GlobalMarkets #ETFFlows #InvestmentTrends #PortfolioStrategy #AustralianInvestors
19
Overview of the US Treasuries Market
US Treasury Yields Rise as Strong Employment Data Reinforces December Fed Rate Hike Expectations
US Treasury yields rose following stronger-than-expected employment data, reinforcing expectations that the Federal Reserve will increase interest rates in December as economic resilience and persistent inflationary pressures continue to shape monetary policy.
The US economy added 165,000 jobs in October, significantly exceeding consensus expectations of 59,000. Employment figures for August and September were also revised upwards by a combined 84,000, while unemployment declined to 4.1% from 4.2%. The figures suggest labour market conditions remain robust, particularly across services industries, providing the Federal Reserve with scope to tighten monetary policy without immediately threatening economic growth.
Read more: lnkd.in/gHjE2GZ3
#USTreasuries #USBondMarket #TreasuryYields #FederalReserve #FedPolicy #InterestRates #Inflation #EmploymentData #USEconomy #FixedIncome #BondMarkets #MonetaryPolicy #GlobalMarkets #InvestmentStrategy #FinancialMarkets

1
15
Overview of the Australian Government Bond Market
Australian fixed interest markets rallied sharply in the week ending 6 November 2026, even as the RBA delivered another 25 basis point increase, lifting the cash rate to 4.85%. As with the previous hike in late September, the move appears to have been well anticipated, with yields falling across every maturity as markets treated the decision as confirmation that policy is now close to its ceiling rather than a signal of more tightening to come.
The 3-year bond yield dropped 12 basis points to close at 4.72%, trading between 4.69% and 4.86% through the week. With the cash rate now at 4.85%, the front end sits notably below the policy rate for the first time in some time, a configuration that typically points to the market pricing an eventual easing cycle rather than further hikes. The 10-year yield fell 14 basis points to 4.99%, within a 4.99% to 5.14% range, while the 30-year eased 11 basis points to close at 5.45%, spanning 5.45% to 5.56%. As the Australian yield chart shows, the 3-to-10-year spread has narrowed as yields fell broadly in parallel, though the curve’s overall upward slope remains intact.
Read more: lnkd.in/gSKMupjM
#AustralianFixedIncome #BondMarkets #AustralianBonds #RBA #InterestRates #BondYields #FixedIncomeInvesting #GovernmentBonds #USTreasuries #YieldCurve #MonetaryPolicy #AUD #CurrencyMarkets #GlobalMarkets #InvestmentStrategy

11
May the festival of lights bring you joy, prosperity and clarity in every decision.
Happy Diwali from all of us at Foresight Analytics! 🪔
#HappyDiwali #FestivalOfLights
37
Weekly Overview of Government Bonds
Australian fixed interest markets extended their consolidation in the week ending 30 October, with longer-dated yields drifting lower while the front end remained anchored. The result was a modest flattening of the yield curve as investors continued to absorb the sharp offshore-driven repricing seen earlier in October.
The 3-year government bond yield was unchanged at 4.84%, trading in a narrow range. With the cash rate still at 4.60%, front-end pricing continues to suggest uncertainty over whether the RBA will need to tighten further.
Read more details here -lnkd.in/eG-Z7YcS
#AustralianBonds #AustralianFixedInterest #FixedIncome #BondMarkets #RBA #InterestRates #GovernmentBonds #YieldCurve #BondYields #BBSW #MoneyMarkets #USMarkets #USTreasuries #AUD #Macroeconomics

12
Overview of U.S. Equities Market
A renewed surge in oil prices weighed on global equities and bonds, adding another inflation risk ahead of the Federal Reserve’s next interest-rate decision. Brent crude settled near US$117 a barrel as escalating Middle East tensions revived concerns over supply disruption, while WTI jumped 4.2% to US$103.63.
U.S. equities weakened, with the S&P 500 down 0.5%, the Dow Jones Industrial Average falling 1.2%, and the Nasdaq 100 little changed. Although selling pressure in technology eased, semiconductor stocks still recorded their longest weekly decline since November, highlighting continued fragility in the AI trade.
Investor sentiment remains cautious. Bank of America expects a tactically risk-off environment into mid-November, citing a combination of AI-related concerns, elevated financing costs and uncertainty around the U.S. midterm elections. Crowded positioning in AI-linked stocks remains a key vulnerability: even modest disappointments in earnings, capital expenditure or guidance could trigger sharper reversals.
Read more - zurl.co/y3qvD
#GlobalMarkets #OilPrices #CrudeOil #Inflation #FederalReserve #InterestRates #USTreasuries #BondYields #USStockMarket #SP500 #Nasdaq #AIMarket #GeopoliticalRisk #MarketVolatility #InvestmentStrategy
31
Overview of the Australian Equities Market
Australian shares finished the week higher, with the S&P/ASX 200 gaining 1.28% to 8,908.1, as investors rotated back into financials and away from weaker mining and consumer names. The All Ordinaries also advanced, closing at 9,025.4.
Banks were the standout performers. Financial stocks have now risen more than 8% over three consecutive weeks, clawing back much of the weakness that followed the August reporting season. The rotation has partly reflected selling pressure in miners, with investors shifting toward banks whenever resources have weakened. Attention now turns to upcoming updates from Westpac, NAB and Macquarie, which should provide a clearer read on how lenders are coping with a softer housing market.
Mining stocks improved over the week despite losses in the final two sessions, ending an eight-week losing streak. The sector has been pressured by high bond yields, elevated oil prices and uncertainty around the AI and data-centre investment cycle.
Read more - lnkd.in/gvdxNDEB
#ASX200 #AustralianShares #ASX #AustralianEquities #ShareMarket #StockMarket #FinancialStocks #BankingSector #MiningStocks #RBARates #InterestRates #AustralianEconomy #MarketOutlook #EquityMarkets
27
Weekly Term Deposits Update
Over the past week, ending October 30, 2026, the strongest opportunity across the deposit curve remains concentrated around 6 months to 1 year. The standout tenor is 1 year, with an average rate of 4.97%, median 5.23%, and top rates of 5.50% from Bank First, ME Bank and Bank Australia. Newcastle Permanent is no longer near the top, while Greater Bank and Macquarie Bank have moved up to 5.40%. The quartile spread has widened slightly to 0.41% from 0.37%, indicating modest increase in dispersion.
For shorter terms, value remains uneven. 1–2-month deposits show stable clustering with quartile spreads at 0.85% and 0.50%, and medians unchanged at 1.40% and 1.65%. Great Southern Bank and in1bank lead at 3.50%–4.00%, but most institutions are materially lower. These terms suit liquidity parking only.
The 3–5-month range is steady. The 3-month average is 4.36%, with the median edging up to 4.50% and top rates at 5.25% from RACQ Bank. MyState Bank has lifted its 3-month rate to 5.05% from 4.95%, and Macquarie Bank has moved to 5.10%. At 4 months, the average is 4.23% and the median 4.30%, with top rates at 5.25% from Police Bank. At 5 months, the median holds at 3.75%, and the quartile spread remains at 0.93%.
Read more - lnkd.in/dzCPRKig
#AustralianDeposits #TermDeposits #FixedIncome #InterestRates #DepositRates #AustralianBanks #SavingsRates #BankingSector #CashManagement #YieldCurve #InvestmentStrategy #PortfolioManagement #JudoBank #RACQBank #FinancialMarkets

48
Australian interest rate market pricing firmed further over the week to 30 October 2026, extending the reversal that began the previous week and decisively confirmed by Wednesday’s inflation data. The 30-Oct curve now sits above both the 23-Oct and 16-Oct readings across virtually the entire forecast horizon, with the gap to the 16-Oct trough the low point of the earlier post-hike retracement widening sharply following the September quarter CPI release.
At the front end, implied rates for November and December 2026 remain closely anchored to the 4.60% cash rate, with the three curves staying tightly bunched at these nearer-dated tenors, even as conviction builds that the November 3 meeting is now a genuinely live decision rather than a formality.
Read more: zurl.co/NAAwU
#AustralianEconomy #RBA #InterestRates #AustralianBonds #BondYields #Inflation #CPI #MonetaryPolicy #RateHike #CashRate #FixedIncome #InterestRateMarkets #FinancialMarkets #MarketOutlook #Macroeconomics

1
23
Featured Macro Insight – Fuel Lifts the Headline, Housing Offers Relief: What September’s CPI Means for the RBA
Australia’s inflation story turned hotter in September. The monthly CPI rose 0.8%, lifting the annual pace from 4.0% to 4.3% and surprising both market expectations of 0.7% and Westpac’s own estimate of 0.6%. Fuel and holiday travel did most of the damage, but the more important message sits in the underlying measures.
Click here to read more: foresight-analytics.com/fuel…
#YieldReport #AustraliaEconomy #Inflation #CPI #RBA #InterestRates #EconomicOutlook #HousingMarket #Macroeconomics #FinancialMarkets

1
12
Chart of the week: AI Credit Stress
Credit stress is increasingly concentrated among the weakest borrowers rather than spreading across the broader market. Yields on U.S. CCC-rated and lower bonds have risen to around 18%, signalling sharply higher refinancing and default risk for highly leveraged companies. By contrast, investment-grade corporate spreads remain near historical lows at roughly 0.9%, suggesting investors are still comfortable with higher-quality credit. Within AI, the four major cloud providers continue to generate ROIC above their WACC, supporting further capital investment. The current adjustment therefore looks more like a repricing of company-specific credit risk than a systemic retreat from the AI investment cycle.
Read more - zurl.co/yj0Xj
#CreditMarkets #HighYieldBonds #CCCratedDebt #CreditSpreads #InvestmentGrade #CorporateBonds #CreditRisk #DefaultRisk #RefinancingRisk #ArtificialIntelligence #AICapex #CloudComputing #ROIC #WACC #FixedIncome

15
Weekly Overview of the ETF Markets
Cybersecurity and Financials Lead as Miners and Precious Metals Slump
The week ending 23 October 2026 saw cybersecurity, financials and energy lead, while miners, precious metals and lithium came under heavy pressure. Global X Cybersecurity ETF (BUGG) led all ETFs at +11.4%, with Betashares Cloud Computing ETF (CLDD) up 7.0% and Betashares Global Cybersecurity ETF (HACK) advancing 6.4%. Betashares Crude Oil Index ETF (OOO) rose 4.4%, while financials featured prominently, with SPDR S&P/ASX 200 Financials ex A-REITS Fund (OZF) and Betashares S&P/ASX 200 Financials Sector ETF (QFN) each up 4.0% and VanEck Australian Banks ETF (MVB) adding 3.6%. Betashares Strong Australian Dollar Hedge Fund (AUDS), First Sentier Global Listed Infrastructure Fund (PWER) and Investors Mutual Concentrated Australian Share Fund (IMLC) rounded out the leaders at +3.4%, +3.3% and +3.3% respectively.
Read more details here - zurl.co/g4gkj
#ETFMarket #ETFFlows #AustralianETFs #USETFs #GlobalMarkets #Cybersecurity #Financials #Semiconductors #ArtificialIntelligence #MiningStocks #PreciousMetals #FixedIncome #InvestmentTrends #AssetAllocation #PortfolioStrategy
23
Overview of the US Treasuries Market
Global government bond yields fell sharply in October as investors moved toward safe-haven assets amid renewed equity-market volatility, concerns over AI investment and rising geopolitical and fiscal risks.
The U.S. 10-year Treasury yield fell to 4.913%, down almost 38 basis points over the month and on track for its largest monthly decline since December 2023. Germany’s 10-year Bund yield also dropped sharply to 3.319%, down 26 basis points. The rally in high-quality government bonds was reinforced by a tech-sector sell-off after a reported US$6.3 billion cryptocurrency theft involving Binance digital wallets added to already fragile sentiment around AI infrastructure spending.
France moved in the opposite direction. Its 10-year government bond yield ended near 4.98%, reflecting investor concern over rising public debt and weaker fiscal credibility. The divergence highlights how sovereign risk is increasingly differentiating bond markets rather than driving them uniformly.
Read more: lnkd.in/gHjE2GZ3
#GlobalBondMarkets #FixedIncome #GovernmentBonds #BondYields #USTreasuries #US10YearTreasury #EuropeanBonds #SovereignDebt #SafeHavenAssets #GlobalMarkets #CentralBanks #InterestRates #Inflation #FiscalRisk #InvestmentStrategy

25
Overview of the Australian Government Bond Market
Australian fixed interest markets extended their consolidation in the week ending 30 October 2026, with yields drifting lower at the long end while the front remained anchored, continuing the steadying pattern that has characterized the market since the sharp offshore-driven pullback earlier in the month. The result was a modest flattening of the curve, with longer maturities doing most of the work.
The 3-year bond yield was unchanged on the week at 4.84%, trading in a tight 4.81% to 4.88% range. With the cash rate still at 4.60%, the front end’s relationship to policy remains little altered, reflecting a market that continues to sit on the fence over further tightening. The 10-year yield fell 7 basis points to 5.13%, within a narrow 5.12% to 5.18% range, while the 30-year eased further, down 11 basis points to close at 5.56%, spanning 5.29% to 5.56%. As the Australian yield chart shows, the 3-to-10-year spread has narrowed again this week as the long end outpaced the steady front end, though the curve’s overall upward slope remains intact.
Short-term funding conditions tightened further, with 3-month BBSW rising 6 basis points to 4.90%, within a 4.82% to 4.90% range, extending its steady climb even as bond yields continue to ease.
Read more: lnkd.in/gSKMupjM
#AustralianFixedIncome #AustralianBonds #BondMarkets #GovernmentBonds #BondYields #InterestRates #RBA #BBSW #US利Treasuries #YieldCurve #FixedIncomeMarkets #AustralianDollar #AUD #GlobalMarkets #FinancialMarkets

26
Weekly Overview of Government Bonds
Australian fixed interest markets were relatively subdued in the week ending 23 October, with yields broadly steady to slightly lower following the sharp rally of the previous week. The market appears to be consolidating rather than extending the recent decline in yields.
The 3-year government bond yield slipped 1 basis point to 4.84%, while the 10-year eased 4 basis points to 5.20%. The 30-year yield was broadly unchanged at 5.67%. With the cash rate steady at 4.60%, the front end continues to imply uncertainty over whether further RBA tightening will be required. The yield curve remains positively sloped, with the 3-to-10-year spread broadly stable after narrowing the previous week.
Read more details here -lnkd.in/eG-Z7YcS
#AustralianBonds #FixedIncome #BondYields #AustralianEconomy #RBA #InterestRates #BBSW #GovernmentBonds #YieldCurve #USTreasuries #AUDUSD #AustralianDollar #MoneyMarkets #FinancialMarkets #Macroeconomics

23
Overview of the Australian Equities Market
Australian shares ended a three-week winning streak as weakness in resources outweighed support from financials and consumer stocks. The S&P/ASX 200 edged 0.02% higher on Friday to 8,795.2 but finished the week down 0.13%.
Materials were the main drag, falling almost 8% over the week and nearly 20% from late-August highs. BHP dropped more than 8% to around six-month lows, while Rio Tinto also weakened as copper prices fell. Gold miners declined as bullion slipped to around US$4,023 an ounce.
Investor sentiment was also pressured by renewed doubts around the AI investment boom. A global sell-off in technology and semiconductor stocks followed less-than-perfect US earnings and concerns about whether AI infrastructure spending can sustain current valuations in a high-inflation, high-rate environment. Locally, NextDC’s value was almost halved after abandoning a Melbourne data-centre expansion, while Firmus recently withdrew its proposed ASX listing.
Read more - lnkd.in/gvdxNDEB
#ASX200 #AustralianShares #AustralianEquities #StockMarket #ShareMarket #ASX #MaterialsStocks #MiningStocks #BH #RioTinto #GoldPrices #ArtificialIntelligence #TechStocks #Inflation #InterestRates
23
Overview of U.S. Equities Market
U.S. equities ended the week under renewed pressure as surging oil prices added another layer of risk to an already fragile market backdrop. Brent crude settled near US$117 a barrel, reviving inflation concerns just days before the Federal Reserve’s next policy decision and weighing on both stocks and bonds.
The S&P 500 fell 0.5%, while the Dow Jones Industrial Average dropped 1.2%. The Nasdaq 100 was broadly flat as selling pressure in technology eased, although semiconductor stocks still recorded their longest weekly decline since November. The weakness in chipmakers is particularly important because AI-related stocks have been a major source of U.S. market leadership and index concentration.
The key issue for equities is now the interaction between strong earnings and a less forgiving macro environment. Corporate results remain supportive, and AI demand is still robust, but higher oil prices, elevated financing costs and renewed geopolitical risk are increasing the hurdle for further multiple expansion. At the same time, the U.S. 10-year Treasury yield moved back to 5.0%, making bonds a more credible alternative to equities.
Read more - zurl.co/y3qvD
#USEquities #StockMarket #SP500 #DowJones #Nasdaq100 #WallStreet #ArtificialIntelligence #AIStocks #SemiconductorStocks #OilPrices #Inflation #FederalReserve #TreasuryYields #MarketOutlook #InvestmentStrategy
36
Australian interest rate market pricing firmed over the week to 23 October 2026, breaking the two-week retracement that had followed the RBA’s late-September hike to 4.60%. Rather than extending the softening seen through early-to-mid October, the 23-Oct curve now sits above both the 16-Oct and 9-Oct readings across almost the entire forecast horizon, suggesting markets are tempering their earlier conviction that the current cash rate marks the definitive peak of this cycle.
At the front end, implied rates for October and November 2026 remain closely anchored to the 4.60% cash rate, with the three curves staying tightly bunched at these nearer-dated tenors, confirming that near-term pricing remains settled even as the picture shifts further out.
Read more: zurl.co/NAAwU
#RBA #AustralianInterestRates #InterestRateMarkets #CashRate #MonetaryPolicy #Inflation #CPI #RateHikes #InterestRateExpectations #BondMarkets #AustralianEconomy #FixedIncome #YieldCurve

29
Weekly Term Deposits Update
Over the past week, ending October 23, 2026, the strongest opportunity across the deposit curve remains concentrated around 6 months to 1 year. The standout tenor is 1 year, with an average rate of 4.96%, median 5.20%, and top rates of 5.50% from Bank First and Bank Australia. The quartile spread holds at 0.37%, indicating sustained tight clustering at this tenor.
For shorter terms, value remains uneven. 1–2-month deposits show stable clustering with quartile spreads at 0.85% and 0.50%, and medians unchanged at 1.40% and 1.65%. Great Southern Bank and in1bank lead at 3.50%–4.00%, but most institutions are materially lower. These terms suit liquidity parking only.
The 3–5-month range is steady. The 3-month average is 4.36%, with the median holding at 4.50% and top rates at 5.25% from RACQ Bank. At 4 months, the average is 4.23% and the median 4.30%, with top rates at 5.25% from Police Bank. At 5 months, the median holds at 3.75%, and the quartile spread remains at 0.93%.
Read more - lnkd.in/dzCPRKig
#TermDeposits #FixedIncome #DepositRates #AustralianBanks #InterestRates #SavingsRates #Banking #CashInvestments #InvestmentStrategy #YieldCurve #RateComparison #RACQBank #BankFirst #BankAustralia #PersonalFinance

24