


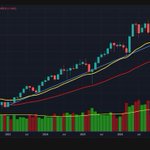






$IOVA | THE RULES OF ENGAGEMENT: ELEVATING THE DEBATE
I love a good debate. I believe the best way to find the truth in the market is to challenge our own biases and listen to the other side. When the debate is of a high level, you will find me there, engaging with data and respect.
But for a debate to be of high quality, it must be built on honesty and intellectual consistency. Lately, I’ve seen a trend in the $IOVA discussion that undermines real analysis: The False Equivalence (Apples to Oranges).
It usually goes like this: someone finds a chart of a completely different biotech that looks similar to IOVA’s current setup, and uses it to predict that IOVA will follow the exact same path. For example, comparing IOVA to a pre-commercial micro-cap that pumped and dumped because their charts both have a "gap" or a "head and shoulders."
Here is the problem: A chart is the shadow of the fundamentals. It is not the fundamentals itself.
You cannot compare a company that has $0 in approved products and $14M in annual revenue to a company that is generating $122M per quarter, with a 60% gross margin, and $382M in cash. The technicals (the 9DMA, the volume profile) tell you how the price is moving in the short term. But the fundamentals tell you what you are actually buying. If you use the technical pattern of a failing company to predict the fate of a commercially successful one, you aren't analyzing; you are forcing a narrative.
When people force arguments or fallacies to push a narrative, I will simply ignore them. I will never block anyone—everyone has the right to free speech. But the right to free speech does not give anyone the right to stupidity.
We don't trade fallacies. We audit the execution.
Disclaimer: This is not financial advice. I am a shareholder who values honest, data-driven debate.
$IOVA | THE 300K TAPE PAINT: ANATOMY OF A SHAKEOUT
Let’s dissect the tape from yesterday, Monday, November 16. The market is an illusionist, and at 4:13 PM (After-Hours), they showed their hand.
Look at the 1-minute chart. At exactly 4:13 PM, a massive block of 300,720 shares was dumped at 7.64, just a couple of cents below the 200-week EMA (7.66). The total volume for the day was only 8.43 million, well below the 15.39M average.
What was the goal? To break the 200-week EMA, paint the daily and weekly candles red, and trigger retail stop-losses. It was a textbook liquidity grab in a low-volume environment.
What actually happened? The market absorbed it. Right after that massive sell order, the price instantly bounced back to 7.51. If it were genuine institutional selling, the price would have collapsed and stayed there. Instead, buyers stepped in and defended the floor.
The Reality: Technically, the price (7.55) is sitting slightly below the 200-week EMA (7.66) but above the 200-day EMA (7.16). We are in a tight compression zone with drying volume. The commercial engine is intact (price hikes of 9% on Amtagvi and 7% on Proleukin starting January 1). The smart money (BlackRock, Vanguard) is accumulating.
They tried to break the floor with a 300K block just below the 200-week EMA, and they failed. The tape tells the truth: the sellers are exhausted, and the buyers are waiting.
We don't trade Monday's after-hours noise. We trade the weekly structure. $IOVA.
Disclaimer: This is not financial advice. I am a shareholder sharing personal technical analysis.

11
690
$IOVA | THE FRESH WATER: PRICING POWER AND SMART MONEY ACCUMULATION
Let’s put on the wetsuit and dive into the new data from the last 48 hours. Forget the recycled legal noise; here is what actually matters.
1. THE JEFFERIES CONFERENCE: PRICING POWER CONFIRMED
During yesterday's fireside chat in London, management confirmed a massive catalyst: starting January 1, Iovance is raising prices. Amtagvi goes up 9% and Proleukin 7%.
Why is this huge? Because it goes straight to the bottom line. With a 60% gross margin, this price hike adds an estimated $10.5M per quarter in pure cash flow. Management also reiterated the $382M cash position and confirmed that TILVANCE-301 (frontline melanoma) is "definitely on track" and meets FDA requirements.
2. SMART MONEY IS BUYING
While retail panics over the NSCLC data and law firm press releases, the biggest institutions are accumulating. New filings show that in Q3, BlackRock added 946,279 shares and Vanguard Capital Management added 192,458 shares. The smart money isn't leaving; they are using the dip to build their positions.
3. THE TAPE IS DRY (AND THE LEVELS ARE CLEAR)
Look at the volume. Yesterday's total volume was 8.42 million, well below the 15.4M daily average. The drop on Monday was pure macro noise (Nasdaq -2.4%) and low liquidity, not a fundamental breakdown.
Technically, the price ($7.55) is sitting slightly below the 200-week EMA ($7.66) but above the 200-day EMA ($7.16). We are in a tight compression zone. The 200-week EMA is the immediate resistance to reclaim, and the 200-day EMA is the hard floor.
THE BOTTOM LINE
The fundamentals are accelerating (price hikes, TILVANCE on track), and the institutions are buying. The legal noise is just a smokescreen to harvest retail liquidity. When the market realizes the commercial engine is untouched and the Q1 cash flow jumps by $10.5M, the re-rating will be violent.
We don't trade headlines. We audit the execution.
Disclaimer: This is not financial advice. I am a shareholder sharing personal research based on public SEC filings and the Jefferies conference transcript.
newsable.asianetnews.com/mar…

1
20
1,116
$IOVA | A QUICK TECHNICAL LESSON: WHY THE WEEKLY CANDLE ISN'T CLOSED YET
I see some traders panicking today because the price is testing the 200-Week EMA (around 7.66). But as a reminder: today is Monday. The weekly chart does not close until Friday at 4:00 PM EST.
1. THE WEEKLY CANDLE IS STILL FORMING
In technical analysis, a weekly candle is not confirmed until the week ends. Right now, we are just seeing the intraday noise of Monday. If the price dips to 7.55 today but closes at 8.00 on Friday, the weekly candle will be a massive bullish hammer. Do not confuse intraday volatility with a confirmed weekly breakdown.
2. THE MACRO TAILWIND
As I commented in a previous post, the Nasdaq is testing its long-term blue trendline. If the macro market bounces this week, IOVA will bounce with it. The 200-Week EMA at 7.66 is the line in the sand.
We don't trade Monday's noise. We trade the weekly structure. IOVA.
Disclaimer: This is not financial advice. I am a shareholder sharing personal technical analysis.
$IOVA | THE HIDDEN CASH FLOW: A $10.5M QUARTERLY BOOST
Let’s talk about the silent catalyst that the market is completely ignoring: the Q1 2027 price increase.
During the Jefferies conference, management confirmed a 9% price increase on Amtagvi and a 7% increase on Proleukin, effective January 1st.
Disclaimer: The following is a speculative projection based on current public data. But the math is simple and the reality is undeniable.
Let’s do the numbers using the Q3 2026 revenue as our baseline ($121.47M):
- Amtagvi (Q3): $101.60M + 9% = $110.74M (+$9.14M)
- Proleukin (Q3): $19.87M + 7% = $21.26M (+$1.39M)
- Total added cash flow: ~$10.53 million per quarter.
Why does this matter? Because this is pure operating leverage. The cost of manufacturing the drug hasn't changed. That extra $10.5M goes straight to the bottom line and the cash reserve.
At a 60% gross margin, the commercial engine is already highly profitable. Add an extra $10.5M per quarter in pure cash flow, and the runway to profitability shortens dramatically. The market is obsessed with the NSCLC noise, but it’s ignoring the $42 million in annualized cash flow being added starting next quarter.
Sooner rather than later, the fundamentals impose themselves. The market can ignore the cash flow for a few weeks, but it cannot ignore it forever.
We don't trade headlines. We do the math. $IOVA
Disclaimer: This is not financial advice. The price increase projection is my own calculation based on Q3 revenue and management guidance.
$IOVA | JEFFERIES CONFERENCE RECAP: PRICING POWER AND THE PHASE 3 CATALYST
The Jefferies Global Healthcare Conference in London just wrapped up. The management team (CFO, CCO, CMO, and Interim CEO) delivered a masterclass in execution. No new magic tricks, just solid fundamentals. Here are the two most important takeaways that the market is undervaluing.
1. PRICING POWER = CASH FLOW ACCELERATION
CCO Dan Kirby dropped a massive detail: Starting January 1, Iovance is implementing a 9% price increase on Amtagvi and a 7% increase on Proleukin.
Why does this matter? It's pure operating leverage. With a gross margin already at 60%, this price hike goes straight to the bottom line. It means more cash flow, faster profitability, and a stronger balance sheet. When a company has the confidence to raise prices in a competitive market, it tells you everything about the demand for their product.
2. THE REAL CATALYST: TILVANCE-301 (Frontline Melanoma)
While the market is obsessed with the NSCLC noise, the CEO confirmed that the Phase 3 TILVANCE-301 trial (Amtagvi + Keytruda in frontline melanoma) is "definitely on track" and meets (or exceeds) FDA requirements.
The data from the COM-202 cohort (frontline) showed a response rate over 60% with an unprecedented Complete Response (CR) rate. The manuscript is being prepared for publication. If TILVANCE-301 succeeds, the melanoma market triples (from 8,500 to over 22,000 patients in the US alone). This is the catalyst that will force a violent re-rating, and it is moving forward exactly as planned.
THE REST OF THE PICTURE:
- Cash: $382M, runway into 2029. No ATM left, no dilution risk.
- International: UK and Switzerland approvals expected in Q1 2027.
- Manufacturing: The Philadelphia facility is modular and can handle all future demand without building new plants.
THE BOTTOM LINE
The commercial engine is scaling (price hikes), and the pipeline is advancing (TILVANCE-301). The market is distracted by the legal noise and the NSCLC data, but the real value of Iovance is being built right now.
We don't trade headlines. We audit the execution.
Disclaimer: This is not financial advice. I am a shareholder sharing personal research based on public SEC filings and the Jefferies conference transcript.
$IOVA vs $SMMT | THE ULTIMATE MARKET DISPARITY: PROMISE VS. REALITY
The market is completely broken. The illusionist is showing you one hand while hiding the real math with the other.
Look at these two screenshots. This is the clearest example of why the current market pricing for $IOVA is a structural anomaly.
1. THE PROMISE: $SMMT (Summit Therapeutics)
- Revenue: $0.00 (Zero. Not a single pill sold).
- Annual Income: -$832 Million (Burning cash at a historic rate).
- Market Cap: $9.19 Billion.
- The Reality: AstraZeneca pumped $2B into a company with no approved product. On Friday, the FDA issued a Complete Response Letter (CRL) rejecting their drug. Yet, the market valued this "hope" at nearly $10 Billion.
2. THE REALITY: $IOVA (Iovance Biotherapeutics)
- Revenue: $378.92 Million (and growing fast, with Q3 alone at $122M).
- Gross Margin: 43.45% (trending toward 60% as in-house manufacturing scales).
- Market Cap: $3.57 Billion.
- The Reality: Iovance has an FDA-approved product (Amtagvi) saving lives today. They have $382M in cash, a runway to 2029, and a pipeline in NSCLC. Yet, the market is pricing it at a fraction of the cost of a pre-revenue biotech.
THE DISCONNECT IS THE OPPORTUNITY
The market is rewarding the "FOMO" of finding the next Keytruda (even if it fails) and punishing the company that is actually executing and generating cash.
But look closely at the IOVA data: 65.19 Million shares short. The bears are trapped, betting against a commercial engine that is already profitable. When the market realizes that the Emperor has no clothes (SMMT), the smart money will rotate into real assets. The violent re-rating of IOVA is inevitable.
We don't trade hype. We audit the revenue. $IOVA
Disclaimer: This is not financial advice. I am a shareholder comparing public financial data to highlight market dislocations.


$IOVA | THE MACRO TAILWIND: WHY THE NASDAQ CHART MATTERS
To understand IOVA, you have to zoom out. Here are the Monthly, Weekly, and Daily charts of the Nasdaq 100 (US100). The market is an illusionist, but the macro structure doesn't lie.
1. THE MONTHLY CHART (The Blue Trendline)
Look at the monthly chart. The price is testing the long-term blue trendline, but it remains above the 20-month EMA (yellow line). The macro bull market is intact. Unless the Nasdaq breaks this blue line, the long-term trend is up.
2. THE WEEKLY CHART (The Compression)
The weekly chart shows a correction. The price broke below the 20-week EMA and is testing the 100-week EMA (green line). This is a healthy pullback in a bull market, not a crash.
3. THE DAILY CHART (The Panic)
The daily chart shows the -4.9 sigma crash (the Fat Tail event) from Nov 5. The price tested the blue trendline and bounced. The volume is high, but the support is holding.
WHY THIS MATTERS FOR IOVA:
The Nov 5 crash wasn't about Iovance; it was a macro liquidity event. The market is testing its long-term support. If the Nasdaq bounces from here, the risk-on trade returns. And when the macro tide rises, the most beaten-down biotech assets (like IOVA, sitting on its 200-week EMA) will experience a violent re-rating.
The market is an illusionist. It uses macro fear to mask the structural strength of individual assets. The macro is testing support, and IOVA is coiled at its floor. IOVA.
Disclaimer: This is not financial advice. I am a shareholder sharing personal technical analysis.


$IOVA | THE WEEKLY CHART SPEAKS: THE FLOOR IS SOLID, THE SPRING IS COILED
Look at this weekly chart. It doesn't lie. While the market is distracted by headlines, the technical structure is screaming one thing: we are sitting on a historical structural floor.
Here is the breakdown of why this chart is the ultimate proof of the asymmetric setup.
1. THE HISTORICAL ACCUMULATION ZONE (The Green Box)
For years, the $3.50 - $7.50 range was the massive accumulation zone. The current price ($7.76) is sitting exactly on the top edge of that historical base. This is where institutions have been building their positions. It is the "home base" of the stock, and it is holding.
2. THE 200 WEEKLY EMA (The Purple Line)
The 200 Weekly EMA is at $7.67. The price is respecting it perfectly. In macro terms, the long-term bullish structure remains completely intact as long as we close above this line. The long lower wick on the recent weekly candles proves buyers are aggressively defending this level.
3. THE VOLATILITY COMPRESSION (The Current Box)
Look at the small box where the price is trapped right now. The volume is drying up. The volatility is compressing. This is the classic "coiled spring" setup. The market is waiting for a catalyst, and the longer it compresses, the more violent the breakout will be.
4. THE ASYMMETRY (The Short Squeeze Setup)
Combine this technical picture with the fundamental data:
- 77% Institutional Ownership (tiny float).
- 65M Shares Short (trapped bears).
- The $122M Q3 revenue engine (commercial reality).
THE BOTTOM LINE
The chart shows a stock that has tested the most critical long-term support (the 200 Weekly EMA and the historical accumulation zone) and is now compressing. The downside is clearly defined (below $7.50), but the upside is a gamma squeeze triggered by trapped shorts and a massive wall of Calls.
This is not a falling knife. This is a loaded spring. The floor is solid.
Disclaimer: This is not financial advice. I am a shareholder sharing personal technical analysis based on public market data.

17
754
$IOVA | THE SHORT SQUEEZE SETUP: 77% INSTITUTIONAL, 65M SHORTS, AND A TIGHT FLOAT
Forget the noise. Let’s look at the hard data that the market is ignoring. The setup for a violent short squeeze is mathematically complete.
1. THE TIGHT FLOAT (77% INSTITUTIONAL OWNERSHIP)
This is the most important metric. Institutional ownership is at 77.03%. This means the "real float"—the shares available for daily retail trading—is incredibly small. The smart money is not leaving. In the last 12 months, there were 159 institutional buyers vs. 56 sellers. Look at the recent moves: Marshall Wace LLP increased its position by +2,233%. Pictet Asset Management is up +867%. Russell Investments is up +165%. The institutions are absorbing the panic.
2. THE SHORT TRAP (65M SHARES SHORT)
As of Oct 30, the short interest is 65.18 million shares, with a Days-to-Cover of 4.16. The shorts have been covering since April (down from 114M), but there is still a massive wall of borrowed shares that need to be returned. If the price breaks above $8.00, the rush to cover will be violent.
3. THE CATALYST (Q3 FUNDAMENTALS)
While the shorts are trapped, the commercial engine is printing cash. Q3 revenue was $122M with a 60% gross margin. The cash runway extends to 2029. The company is not going bankrupt; it is scaling.
THE BOTTOM LINE
We have a tiny float (77% institutions), a massive short interest (65M shares), and a loaded options chain (as I posted earlier). The commercial engine is the fuel. The technicals are the match.
When the price breaks above $8.00, the shorts and the Market Makers will be forced to buy. That’s when the squeeze turns violent.
We don’t trade headlines. We follow the data. $IOVA
Disclaimer: This is not financial advice. I am a shareholder sharing personal research based on public market data.


Join Iovance bright and early Eastern Standard Time Monday morning at the Jefferies Global Healthcare Conference in London.⏰
To listen in on management's fireside chat, click: ir.iovance.com/events/event-…
#JefferiesHealthcare #TILCellTherapy

$IOVA | THE TECHNICAL AUTOPSY: EMAS, MAX PAIN, AND THE GAMMA WALL
Strip away the headlines. Let’s look at the tape. The technical structure of $IOVA is setting up a textbook "coiled spring" scenario. Here is the exhaustive data breakdown from the weekly, daily, and options chain.
1. THE WEEKLY CHART: THE MACRO FLOOR HOLDS
Look at the 1W chart. Despite the 35% crash, the long-term trend remains intact.
- The price ($7.76) is respecting the **200 EMA (purple line) at $7.67**.
- The 100 EMA (green line) is at $6.60.
As long as the weekly candle closes above $7.67, the macro bullish structure is undefeated. The long lower wick on the current weekly candle proves buyers are aggressively defending this zone.
2. THE DAILY CHART: THE VOLATILITY SQUEEZE
On the 1D chart, we are trapped in a tightening range.
- Support: The 200 EMA is holding at $7.16.
- Resistance: The 100 EMA is pressing down at $9.04.
- The Trend: The 20 EMA ($9.83) is crossing below the 50 EMA ($10.33). The retail crowd sees this as a "Death Cross" and panics. Institutional traders see it as the exhaustion of the downtrend after a gap-down. The volume is drying up to 11.68M (below the 15.4M average), confirming the sellers are out of ammunition.
3. THE 1-MINUTE TAPE: THE ALGORITHMIC PIN
Look at the 1-minute chart from Friday, Nov 13. The price was pinned in a tight $7.66 - $7.76 range. The low of the day was $7.46, and the high was $7.88. This is not random. This is algorithmic pinning to expire short-term retail options at the $7.50 and $8.00 strikes. The market makers are harvesting liquidity.
4. THE OPTIONS CHAIN: THE GAMMA WALLS
This is where the real war is happening.
- November 20 Expiry: Massive Open Interest (OI) on $7.50 Puts (1,141) acts as a magnetic floor. The Market Makers who sold these Puts must buy stock if we dip below $7.50.
- December 18 Expiry: The $10.00 Calls have a massive OI of **7,748**. The $12.50 Calls have 3,331.
- January 2027 Expiry (The Institutional Bet): Look at the long-term positioning. The $20.00 Calls have an OI of 20,688. The $10.00 Calls have **19,732**. The $15.00 Calls have **11,093**. Meanwhile, the $10.00 Puts have an OI of 25,957 (likely institutional hedges).
THE CONCLUSION: THE FAT TAIL SETUP
The market is currently pinned at $7.76 by the "Max Pain" theory for the November expiry. But the January 2027 options chain reveals the truth: the institutional money is positioned for a violent re-rating. There are over 50,000 open Call contracts between the $10, $15, and $20 strikes for early 2027.
If the stock breaks above $8.00 and approaches $10.00, the Market Makers who sold those Calls will be forced to buy shares to cover their Gamma exposure. This is the "Gamma Squeeze."
The fundamentals (Q3 revenue of $122M, 60% margin) are the fuel. The technicals are the ignition. We are sitting on the weekly 200 EMA, with volume drying up, and a massive wall of Call options waiting to be triggered.
Stop watching the headlines. Watch the tape. $IOVA
Disclaimer: This is not financial advice. I am a shareholder sharing personal technical research based on public market data and options flow.


| THE FAT TAIL THEORY: WHY GAUSSIAN MATH IS KILLING RETAIL
Look at the data. On November 5, the Nasdaq dropped 4.9 standard deviations. According to the classic Gaussian "Normal Distribution," a move like that should only happen once every 8,300 years.
Yet, it happened. Why? Because the market is not a perfect bell curve.
This is the "Fat Tail" theory. And if you understand it, you understand exactly what is happening with IOVA right now.
1. THE ILLUSION OF THE BELL CURVE
Classic financial models assume that 95% of market moves happen within 2 standard deviations. They treat the market as a rational, predictable machine.
But the market is not rational. It is an illusionist. The Gaussian curve massively underestimates the probability of extreme events. On the left side, we call these "Black Swans" (crashes). On the right side, we call them "violent repricings" (short squeezes, buyouts, FDA approvals).
2. THE TWO SIDES OF THE FAT TAIL
In biotech, the tails are always fat. When a company has a binary event (like the NSCLC data drop), the market doesn't move 2%; it crashes 35% in a single day. The Gaussian model says that's "impossible." The reality is that it's standard operating procedure in biotech.
But here is the twist: Fat tails cut both ways.
Just as the crash happens faster and harder than the models predict, the rebound happens the exact same way. When the fundamental reality (Q3 revenue of 122M, 60% gross margin, cash runway to 2029) becomes undeniable, the stock will not grind up slowly. It will gap up in a violent, short burst of buying.
3. THE 7.60 FLOOR: WHERE THE MATH BREAKS
Right now, IOVA is trapped at the 7.50-7.60 floor. The volume is drying up. The retail investors are terrified of the legal noise. They are using Gaussian thinking: "The stock is falling, the legal risk is high, so I will sell my shares."
But the institutions and market makers know the tails are fat. They are quietly absorbing the liquidity, using the "impossible" crash to accumulate shares at a discount before the "impossible" upside tail hits.
THE BOTTOM LINE
The Nasdaq just experienced a 1-in-8,300-year event. The market is not normal. The Gaussian models are broken.
Stop trying to trade IOVA as if it were a rational, linear stock. It is a biotech asset with fat tails. The crash was violent and "impossible." The rebound will be equally violent and "impossible."
The fundamentals are the anchor. The legal noise is the illusion. The floor is solid. Wait for the fat tail to hit to the upside.
Disclaimer: This is not financial advice. I am a shareholder sharing personal research based on public SEC filings and market structure analysis.

3
513
| THE FAT TAIL THEORY: WHY GAUSSIAN MATH IS KILLING RETAIL
Look at the data. On November 5, the Nasdaq dropped 4.9 standard deviations. According to the classic Gaussian "Normal Distribution," a move like that should only happen once every 8,300 years.
Yet, it happened. Why? Because the market is not a perfect bell curve.
This is the "Fat Tail" theory. And if you understand it, you understand exactly what is happening with IOVA right now.
1. THE ILLUSION OF THE BELL CURVE
Classic financial models assume that 95% of market moves happen within 2 standard deviations. They treat the market as a rational, predictable machine.
But the market is not rational. It is an illusionist. The Gaussian curve massively underestimates the probability of extreme events. On the left side, we call these "Black Swans" (crashes). On the right side, we call them "violent repricings" (short squeezes, buyouts, FDA approvals).
2. THE TWO SIDES OF THE FAT TAIL
In biotech, the tails are always fat. When a company has a binary event (like the NSCLC data drop), the market doesn't move 2%; it crashes 35% in a single day. The Gaussian model says that's "impossible." The reality is that it's standard operating procedure in biotech.
But here is the twist: Fat tails cut both ways.
Just as the crash happens faster and harder than the models predict, the rebound happens the exact same way. When the fundamental reality (Q3 revenue of 122M, 60% gross margin, cash runway to 2029) becomes undeniable, the stock will not grind up slowly. It will gap up in a violent, short burst of buying.
3. THE 7.60 FLOOR: WHERE THE MATH BREAKS
Right now, IOVA is trapped at the 7.50-7.60 floor. The volume is drying up. The retail investors are terrified of the legal noise. They are using Gaussian thinking: "The stock is falling, the legal risk is high, so I will sell my shares."
But the institutions and market makers know the tails are fat. They are quietly absorbing the liquidity, using the "impossible" crash to accumulate shares at a discount before the "impossible" upside tail hits.
THE BOTTOM LINE
The Nasdaq just experienced a 1-in-8,300-year event. The market is not normal. The Gaussian models are broken.
Stop trying to trade IOVA as if it were a rational, linear stock. It is a biotech asset with fat tails. The crash was violent and "impossible." The rebound will be equally violent and "impossible."
The fundamentals are the anchor. The legal noise is the illusion. The floor is solid. Wait for the fat tail to hit to the upside.
Disclaimer: This is not financial advice. I am a shareholder sharing personal research based on public SEC filings and market structure analysis.
$IOVA | THE LEGAL AUTOPSY: WHY THE 2025 SECURITIES CLASS ACTION IS COLLAPSING
Let’s dive into the actual legal filings. I just reviewed the docket for the consolidated securities class action (Case No. 5:25-cv-04177, N.D. Cal.). The plaintiffs are suing over the May 2025 revenue guidance cut, claiming Iovance misled investors about its ability to scale the ATC network.
Here is the cold, hard legal reality of why this lawsuit is a textbook example of "buyer's remorse" masquerading as securities fraud.
1. THE CURRENT STATUS: THE MOTION TO DISMISS IS PENDING
This is not a new case. The court consolidated the actions and appointed Lindy Merrill and Tony Djie as Lead Plaintiffs on December 15, 2025 . The plaintiffs filed their Consolidated Amended Complaint on April 15, 2026. Iovance filed its Motion to Dismiss on June 15, 2026. The hearing was held on October 7, 2026, and the reply brief was filed on October 14, 2026 . The judge has the case under submission. The market is pricing in a loss, but the legal reality is that Iovance is fighting to get this dismissed entirely.
2. THE CORE ALLEGATION
The complaint alleges that Iovance created a "false impression" of its revenue outlook and was "ill-equipped" to capitalize on growth because it relied too heavily on scaling ATCs. They claim the company knew it couldn't process patients as fast as the drug could be manufactured. This is an attack on operational forecasting, not scientific fraud.
3. THE DOCTRINAL DEFENSE: "BESPEAKS CAUTION"
To win a securities fraud case, plaintiffs must prove the company made false statements of *material fact*. Forward-looking revenue projections are protected under the "Bespeaks Caution" doctrine if accompanied by meaningful warnings.
If you read Iovance’s 10-Q and 10-K from 2024, the Risk Factors explicitly warned about:
- The complexity of the TIL supply chain.
- Delays in onboarding new ATCs.
- The learning curve for hospitals treating their first patients.
Iovance warned the market that scaling would be bumpy. Investors who ignored these written warnings and bought assuming a flawless rollout cannot later sue for fraud when the risk materialized. That is the definition of an assumed risk.
4. THE JURISPRUDENTIAL SHIELD: NOVOCURE**
Federal courts are tired of policing corporate optimism. In *Bazzelle v. NovoCure* (S.D.N.Y. 2025), a court dismissed a nearly identical securities class action over trial data and operational forecasts. The judge ruled: **"Securities law is simply not a vehicle through which courts will police disagreements... or the parameters of clinical trials."
The plaintiffs here are essentially arguing that management should have forecasted the ATC bottleneck perfectly. The law does not require perfect foresight; it only prohibits intentional fraud.
5. THE PSLRA HAMMER: RULE 11 SANCTIONS
Here is the trap the plaintiff firms (Rosen Law, Levi & Korsinsky) are walking into. Under the Private Securities Litigation Reform Act (15 U.S.C. § 78u-4(c)), the court *must* review whether the complaint complies with Rule 11. If the court finds the complaint lacks factual or legal basis (e.g., ignoring the 10-Q warnings), the law creates a presumption that the plaintiffs must pay the defendant's legal fees.
Iovance's management has already proven they don't get extorted (look at the Solomon case, where they won $650K in fees). Filing a Motion for Sanctions alongside their Motion to Dismiss is the legal equivalent of a nuclear strike.
READ THE DOCKET YOURSELF:
Don't take my word for it. The entire case file is public. You can track the Motion to Dismiss, the hearing dates, and the judge's eventual ruling right here:
courtlistener.com/docket/702…
THE BOTTOM LINE
The bears are celebrating a lawsuit that attacks operational forecasting, not scientific fraud. The docket shows the Motion to Dismiss is fully briefed and awaiting the judge's ruling. Meanwhile, the commercial engine is printing $122M a quarter with a 60% gross margin.
We don’t trade headlines. We read the docket. $IOVA
Disclaimer: This is not financial or legal advice. I am a shareholder analyzing public court filings and SEC documents.

$IOVA | DECODING THE CEO'S FORM 4: A BAD SIGN FOR BEARS, A WIN FOR LONGS
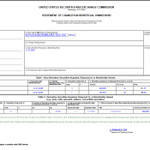
A new SEC Form 4 just dropped for Frederick G. Vogt (Interim CEO & General Counsel) dated November 11, 2026. At first glance, you might see a large number of shares being "disposed of." But if you read the filing carefully, the reality is the exact opposite of a sell-off. For the bears, this is bad news. For the longs, it’s a confirmation of confidence.
Here is the exact breakdown of what happened:
1. The Option Exercise (Table II)
Vogt held 200,000 stock options with a strike price of $7.55 that were set to expire on November 14, 2026. On November 11, he exercised them (Code M) to buy those shares.
2. The "Cashless" Payment (Table I)
To buy 200,000 shares at $7.55, he would need $1.51 million in cash. This is what is known as a "Cashless" operation. It is a standard mechanism for executives: instead of pulling that money out of their own pocket, they sell a portion of the newly acquired shares at the current market price to cover the cost. Vogt sold 191,363 of those newly acquired shares at $8.09 (Code D). This generated the exact funds needed to pay for the options and cover the mandatory tax withholding.
3. The Net Result
After the math (200,000 acquired minus 191,363 sold to cover costs), Vogt kept 8,637 net new shares (Code A). The filing explicitly states: "No shares were sold in the open market. This is not an open market sale of securities."
THE REALITY CHECK:
If the CEO wanted to exit the company or cash out for liquidity, he would have sold his existing shares in the open market. He didn't. He exercised his expiring options at $7.55, paid the taxes, and increased his direct holdings to 604,144 shares.
The bears are hoping for insider panic, but the math shows the opposite. The CEO is locking in his position and betting on the upside. We don't trade headlines. We read the filings. $IOVA.
Disclaimer: This is not financial advice. I am a shareholder sharing personal research based on public SEC filings.
sec.gov/Archives/edgar/data/…

$IOVA | THE LEGAL TRAP: WHY A COUNTERSUIT IS WEAK, BUT SANCTIONS ARE LETHAL
As an investor and a lawyer, I get asked the same question: Why doesn't Iovance sue Pomerantz and the other plaintiff firms for damages?
The short answer: Under U.S. law, suing a law firm for "malicious prosecution" over a securities class action is a legal quagmire. The Noerr-Pennington doctrine protects the right to petition the courts, and proving "malice" or "sham litigation" is nearly impossible. A countersuit for damages would burn millions in cash and distract management.
But here is the legal trap the market is missing: Iovance doesn't need a countersuit. It has the PSLRA.
1. The PSLRA Mandate (15 U.S.C. § 78u-4(c))
The Private Securities Litigation Reform Act of 1995 contains a unique, mandatory provision. The court must review whether the complaint complies with Rule 11. If the court finds the complaint lacks factual or legal basis, the law creates a presumption that the sanction should be "reasonable attorneys' fees and other expenses" of the opposing party.
2. The "Bespeaks Caution" Shield (10-Q Evidence)
How do you prove the lawsuit is frivolous? You point to the company's own SEC filings.
- Page 4: "Preliminary clinical results... may not be reflected in the final analyses... or supportive of product approval."
- Page 73: "As clinical trials continue... interim efficacy data may show a decline in patient response rate."
Iovance explicitly warned the market that Phase 2 data could decline and the FDA might disagree. The plaintiffs ignored these written warnings. A complaint that ignores explicit SEC warnings is the textbook definition of a frivolous filing.
3. The NovoCure Precedent (S.D.N.Y. 2025)
In Bazzelle v. NovoCure, a federal court dismissed a nearly identical lawsuit and ruled: "Securities law is simply not a vehicle through which courts will police disagreements in the cancer research community." The plaintiffs didn't even appeal. If Iovance's counsel uses this precedent, they can argue the lawsuit was dead on arrival.
THE STRATEGY:
Iovance should not file a counterclaim. They should file a Motion for Sanctions under the PSLRA alongside their Motion to Dismiss.
If the judge grants it, Pomerantz doesn't just lose the case; they pay Iovance's legal fees. This sends a shockwave through the plaintiff bar: Iovance is not a piggy$IOVA.
Disclaimer: This is not fina bank. If you file a frivolous lawsuit, you will bleed cash.
We don't trade headlines. We read the statute. The legal case is not just weak; it's a liability for the plaintiffs. ncial or legal advice. I am a shareholder sharing personal research based on public SEC filings and federal case law.
$IOVA | THE MAGIC TRICK: WHY YOU ARE BEING PLAYED
The market is a magician. It shows you one hand while the other runs the trick. Retail reads candlesticks. Market makers read order flow. That's the illusion.
The visible hand (Retail theater):
All the media noise, the talking heads on financial TV, the social media narratives—they're engineered for one purpose: to harvest your liquidity. Look at $IOVA right now. They handed you the "obvious" panic over the NSCLC data and the recycled legal headlines. They parked the price at the $7.50-$7.60 support, exactly where the algorithms are coming to collect the toll from retail stop-losses. It's mass psychology executed to perfection. The chart you're staring at isn't the market—it's the stage.
The invisible hand (The real trick):
The actual game is played in the microstructure. Look at the tape: the volume has dried up to two-week lows while the price stubbornly refuses to break support. That is textbook institutional accumulation—smart money quietly absorbing the retail panic through dark pools and silent blocks. While the crowd hunts moving-average crossovers and panics over law firm press releases, the big players are carving up the liquidity. They know the commercial engine is printing $122M a quarter with a 60% gross margin.
The digital footprint:
The market is neither neutral nor random. Every trap, every engineered dislocation, every forced liquidation leaves a mathematical fingerprint in the order book structure. The price on your screen ($7.76) doesn't reflect fair value—it reflects the footprint of the trick they just finished pulling. The commercial fundamentals (Q3 record revenue, cash runway to 2029) and the legal doctrine (Bespeaks Caution) are the reality. The depressed price is the illusion.
Stop watching the hand they show you. Start reading the footprint they leave behind. The float is going to be incredibly tight when the smoke clears. $IOVA
Final Thought: The Illusionist’s Warning
I am not here to complain, nor am I crying about the price. I am here to put you on high alert. In the end, the market is nothing more than an illusionist. It will make you stare at the flashing red candles while the real money is made in the shadows. Do not let the magician distract you from the reality printed in the SEC filings. The trick is only a trick as long as you believe it.
Disclaimer: This is not financial advice. I am a shareholder sharing personal research based on public SEC filings.
People living with lung cancer inspire our work every day. Our commitment to finding answers goes beyond #LungCancerAwarenessMonth.
We’re advancing TIL cell therapy in previously treated metastatic NSCLC. Learn about our lung clinical trials: iovance.com/clinical-trials/

15
616
