

data visualisation & information design
Hamburg /// Wellington
Joined March 2013
- Tweets243
- Following723
- Followers445
- Likes275








The new "New Zealand Tsunami Database" of @gnsscience is an updated version of the old "New Zealand Palaeo Tsunami Database" of @niwa_nz which, as the name suggests, also includes prehistoric records
New: app.dumpark.com/nz-tsunami-d… (preliminary)
Old: ptdb.niwa.co.nz

ALT Screenshot of the website, showing a map of New Zealand with historic tsunami records and related source events

Thanks to new @EQCNZ & @gnsscience data, we now know which parts of NZ are most at risk from tsunami. "When you look at the map its quite heavily distributed around our east coast in particular," says @UCNZEarthEnv @Dr_TRob. bit.ly/3o8U8Gi
Main upgrade was the inclusion of source events responsible for triggering the tsunamis and linking them to the tsunami records and observations on land

ALT Screenshot of the website, showing a map of New Zealand with a tsunami source event selected and related records highlighted on land
dumpark data visualisation retweeted

Ich kam bislang noch nicht dazu, dieses Hammer-Programm angemessen zu würdigen - jetzt aber:
🔔🔔🔔 Aufgemerkt #ddj-folks, #dataviz-people & #maplovers Beginnt das neue Jahr mit einer kleinen, aber sehr erlesen interdisziplinären (Online)-Konferenz rund um Landkarten... 1/n
This Post is from an account that no longer exists. Learn more
dumpark data visualisation retweeted

Should line interpolation for time series data always be linear? Of course, lines should pass through the data points, but curves are so much nicer.


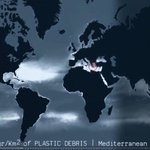
Much better of course with an image preview showing the 3 principal science layers:
- Floating plastic concentration (Eriksen et al 2014)
- Mismanaged plastic waste (Lebreton & Andrady 2019)
- River emissions (Lebreton et al 2017)
plasticnavigator.wwf.de


Have been pretty silent here lately but today we are especially excited about the launch of the Global Plastic Navigator we developed with WWF Germany to show the extent of marine plastic pollution, as well as WWF's efforts and countries' commitments to combat it.

Die Ozeane sind voller Müll. 🌊🧃😖Man kann sie sich fast als Plastiksuppe vorstellen, mit großen Plastikteilen und kleinstem #Mikroplastik. Aber wo sind die Quellen? Und wo geht das Plastik hin? Unsere interaktive Karte zeigt's euch: plasticnavigator.wwf.de/#/de #StopPlasticPollution
dumpark data visualisation retweeted

Calling all FOSS technologists, journos and human rights defenders from around the world. We URGENTLY need you to sign this letter for the US Congress to save OTF and
Internet Freedom. Mobilize others! #SaveInternetFreedom
saveinternetfreedom.tech/

dumpark data visualisation retweeted

Wicked demonstration by @geo_spatialist of what is possible with quality elevation data, a historic map, the right tools and mad skills. This rendering is recreating the perspective of a photo taken in Glacier National Park with Mt Carter towering in the back

This seem about right, @tmfrnz? I hope you like my photoshop work. It's virtually seamless. Graphic design is my passion. /s


dumpark data visualisation retweeted
We are still looking for help with two exciting human rights projects in the coming months, both open source and paid opportunities. DM me up for further details and please feel free to retweet - cheers!

Any React developers out there keen to work with us on projects tracking #HumanRights? Feel free to send me a DM - thanks!
dumpark data visualisation retweeted
Any React developers out there keen to work with us on projects tracking #HumanRights? Feel free to send me a DM - thanks!
dumpark data visualisation retweeted

🤩The campaign goal for RAW 2.0 is finally reached!
This wouldn't have been possible without all of your help! THANK YOU SO MUCH!❤️
Bear with us because stretch goals are just behind the corner! Please continue to show your love! 🙌
18 hours to go!
#dataviz #opensource

Only 4 days left to support the new version of the excellent and open source @rawgraphs. Glad to have finally made our little contribution and we look forward to the release in 2020

Have you backed our campaign?NO??!?!...well...it’s not too late.
You still have 4 days to donate and support us!
Are you one of the 242 backers? You can still contribute by sharing the campaign on social media and within your network.
igg.me/at/rawgraphs2/x/20662…
#Dataviz

Check out this beautiful map (as well as all the other maps by @xycarto on xycarto.com)
This Post is from an account that no longer exists. Learn more
dumpark data visualisation retweeted

Adjusted? Nominal? What is @AlbertoCairo talking about? You still have time to find out until we discuss his book on Nov 27. Learn more about our book club here: blog.datawrapper.de/datavis-…

dumpark data visualisation retweeted

📽️ Great video from @BritishPathe about the process of mapmaking in 1961. I think it's about the @OrdnanceSurvey 🗺️
🔗 youtu.be/L7SJVBX7jxo


dumpark data visualisation retweeted
Thanks @EU_opendata for organising the excellent #EUDataViz conference in Luxembourg! So important to share knowledge about better informing citizens & policy makers for better decisions. They are needed urgently to address the challenging issues of our time
dumpark data visualisation retweeted
Comprehensive composition of (inconsistent) colour use for genders in official statistics by country and over time (from 2017, top to bottom) by Mojca Bavdaž et al of University of Ljubljana, presented at #EUDataViz

dumpark data visualisation retweeted
I'm trying something new: Until the book club discussion on Nov 27th, I'll tweet a quote from @AlbertoCairo's "How Charts Lie" almost every day. Let's start:
