






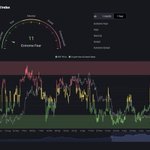


Crypto has spent:
- 117 days of the last year in extreme fear
- 155 days in fear
- 0 days in extreme greed

2
10
782
$ETH liq maps update.
Shorts are still heavily stacked above price, with the skew becoming even more extreme on the 90D and 1Y maps.
Estimated short liqs above / long liqs below:
- 30D: $4.29B / $437M = 9.8x
- 90D: $5.12B / $360M = 14.2x
- 180D: $9.99B / $4.60B = 2.2x
- 1Y: $15.44B / $4.24B = 3.6x
Compared to the previous update:
- 30D: 10x -> 9.8x
- 90D: 4x -> 14.2x (!!)
- 180D: 2x -> 2.2x
- 1Y: 2.5x -> 3.6x
The 90D skew is now ridiculous, and the 1Y imbalance has widened further despite the continued dump.
FYI these are estimated liquidation exposures, not guaranteed liquidations.


$ETH has significantly more estimated short liquidations stacked above price across all four liquidation maps.
I haven’t seen the 1Y map this lopsided in ages. Usually it’s the shorter timeframes showing these kinds of imbalances.
Estimated short liqs above / long liqs below:
30D: $4.73B / $492M - 9.6x
90D: $4.32B / $1.04B - 4.2x
180D: $11.93B / $6.32B - 1.9x
1Y: $12.69B / $5.16B - 2.5x
And ETH is sitting around $1,927.


$BTC and $ETH weekend PA.
BTC:
~8.8K net taker spot sells
~17.8K net taker futures sells
OI down ~10.8K
ETH:
~166K net taker spot sells
~424K net taker futures sells
OI down ~164K
Both have bounced off the lows, but spot CVD remains near the bottom. ETH’s futures CVD has recovered somewhat while spot selling continues.
Just relentless selling and deleveraging.


Over the last 21 hours:
$BTC had ~4.9K net taker aggressive spot sells
$ETH had ~95.2K net taker aggressive spot sells


3
8
794


$BTC FVGs getting filled
1D FVG tapped
2D and 5D FVGs filled >100%
FYI: an FVG (fair value gap) forms when price moves sharply, leaving space between the wicks of the first and third candles.


magnus retweeted

Tom lee will be the biggest loser in wall street history. He will lose a ton of money alongside with all the investors money.
He is already underwater by 7-8BillionUSD in red.
ETH is going lower.


$ETH has significantly more estimated short liquidations stacked above price across all four liquidation maps.
I haven’t seen the 1Y map this lopsided in ages. Usually it’s the shorter timeframes showing these kinds of imbalances.
Estimated short liqs above / long liqs below:
30D: $4.73B / $492M - 9.6x
90D: $4.32B / $1.04B - 4.2x
180D: $11.93B / $6.32B - 1.9x
1Y: $12.69B / $5.16B - 2.5x
And ETH is sitting around $1,927.


$BTC $ETH inverted head & shoulders (IH&S)
BTC’s pattern still looks not bad but ETH’s right shoulder is potentially too deep.
Volume for both falling from left to right


Some people are calling this $ETH pattern an inverted head & shoulders.
I’ve marked a similar IH&S from 2025 with neckline for comparison.
Both have volume declining from left to right.
(Bottle of inverted head and shoulders for reference).


13
888