

Data Analytics & Automation Consultant | UK Public Sector TUG Co-Lead | Tableau Desktop Certified Associate | Tableau Featured Author 2020 | 🌱
Brighton, England
Joined March 2019
- Tweets531
- Following455
- Followers786
- Likes2K



Haven't been on here in quite a while but this is a nice thing to come back to.
Thank you @tableaupublic 🎅

Discover a new chart type each day with this #VizOfTheDay by @data_and_stuff.
Countdown to the holidays with this interactive advent calendar viz. tabsoft.co/3Y8KiaK

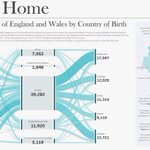
In my latest #DataViz, I look at #Census2021 data on #England and #Wales residents counties of birth.
Explore the #populations within each #UpperTierLocalAuthority in this interactive @tableau dashboard here:
tabsoft.co/49jG03h

New #Viz time!
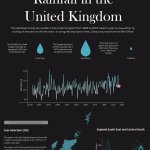
With the hot weather making a comeback, I went in the other direction and looked at #Rainfall data in the #UnitedKingdom
Access the interactive @tableau workbook here:
bit.ly/480GI4Q
#Data #Analytics #DataViz #Climate #DataVisualisation #Tableau
James Goodall retweeted

🚨 NEW #IronQuest Recap | Advanced Charts 🚨
sarahlovesdata.co.uk/2023/07…
Thank you to everyone who entered the last round of #IronQuest! We received a record number of #VizOfTheDay awards for this round, plus our highest number of entries for any round since 2021! 🎉
Check out all of the entries in the recap post! 🤩
#datafam #tableau #dataviz

Thank you @tableaupublic for making my #FuelPoverty viz today's #VizOfTheDay! I'm blown away.
Don't forget to keep checking #TableauPublic #VOTD every weekday for more inspiring #datafam content
Fuel poverty is the inability to afford to keep one's home adequately heated. Explore this #VizOfTheDay by @data_and_stuff to learn more about the situation in England from 2014 to 2021. tabsoft.co/3DfbiJX

It's been a minute but...
New viz time! After doing work for colleagues on #FuelPoverty in #Surrey, I took a wider look at the picture across #England.
This @tableau workbook allows you to view relative fuel poverty at different geographical levels:
bit.ly/3pHsuEA
Join us on 16th March at 14:00 GMT for the first #PublicSector @tableau #UserGroup of 2023!
Tune in to hear #HampshirePolice and #SurreyCountyCouncil's data journeys!
We're still looking for another speaker - if you're interested please reach out!
tabsoft.co/3ZfYTy5
The silence is deafening @TheUnderworld

@TheUnderworld nice of your staff to use the words "it's not that bad" and "he's OK really" when my wife pointed out the man who followed her into the toilets and groped her during
@counterparts905 last night
#SexualAssault #CamdenUnderworld #MeToo
It's been a while since I came on here, but with the latest release of #Census2021 data, I thought I'd try and dust off the cobwebs.
Interactive @tableau workbook here -> tabsoft.co/3OXaOfm
#tableau #data #datanalytics #viz #dataviz
This Wednesday (6th April) - tune in the the @tableau #PublicSector summit! Featuring some great presentations from #NHS, #WorldEconomicForum & #UnitedNations - this one will definitely be interesting!
Sign up here 👇👇
tableau.com/learn/webinars/p…
Thank you to @iESELtd for hosting tonight and congrats to everyone else there tonight representing #innovation in #PublicSector

Gold Winner for Best Use of Data Insight is @SurreyCouncil for its Data Insight programme. 🎉👏 This award recognises the use of data insight and the application of data, rewarding creative approaches to managing and manipulating data to deliver outstanding results.

I've struggled to find inspiration to work on my own vizzes for some time, but this week I managed to finally put something together
This @tableau viz looks at the rising gap between #HouseholdIncomes and #HousePrices
Interactive @tableaupublic viz: tabsoft.co/3hcQCqF
Well this #log4j stuff has been fun, but on the plus side, we now have COPY & PASTE in @tableau !!! #gamechanger #tableau
Well it's been a while! What with buying a house, planning a wedding & working on an apprenticeship, I've not had much time.
But I'm back with a brand new #TableauBitesize looking at creating a relative date range filter that can also be manually edited
bit.ly/3oha0r5
Lovely clean viz here @_talkdatatome_ 💪🏻💪🏻

NASA's Goddard Institute of Space Studies looking at the deviation in monthly temperature 1880 - 2020 compared to the 1851-1880 mean.
MoM21 W3.
#dataviz #ClimateCrisis #data #globalwarming #Tableau #NASA #climatechange


Check out this stunning @tableau viz that @dan_harmer created, showing the results of a survey commissioned by #SurreyCountyCouncil & #SurreyHeartlands to understand the impact of #COVID19 on residents
tabsoft.co/3qMPduZ

As #SurreyCountyCouncil works with @NHS and @reigatebanstead for another round of surge testing, I'm grateful again to be asked to help develop a tool in assisting with this.
Lookup your postcode to see if you're in the testing area.
#BlogPost to follow
bit.ly/35wFhfu
Really pleased to have been asked to help develop a tool to support this fantastic initiative!
You can enter your (Surrey) postcode to find the nearest locations to collect or donate products in the map via the link below:
surreycc.gov.uk/social-care-…
#Tableau #PeriodDignitySurrey
This Post is from an account that no longer exists. Learn more