

Wall Street analyst, Portfolio Manager
Austria
Joined September 2016
- Tweets536
- Following44
- Followers1.1K
- Likes14

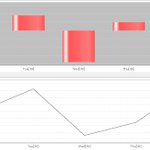


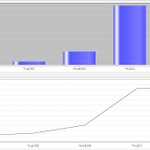



As we can see in the histogram below, OPEX week in January has not been one of the more bullish ones. There is weakness followed by recovery, leaving the index unchanged. Declining cycles are more than offsetting the OPEX effect.

Here is the outlook on January from 3 viewpoints.
All Months: Up 59.1% of the time for an average gain of 0.84%
Month in election year Up 44.1% of the time for a change of -0.4%
Year ending in 3: 76.9% for a 2.2% gain
Both of the prior conditions: Up 66.7% for a change of 1.1 %.

How does one apply contrary opinion to this Time cover? Perhaps concert ticket sales are headed for a bear market? The result of a new lock down, COVID or climate?

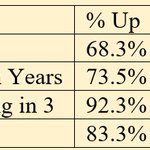
There is a seasonal quirk in the semiconductor index in which there is weakness from the 7th through the 16th. The index has been down 68% of the time in the last 28 years. From the 16th to the 31st, however, the index rose 75% of the time.


Here is how the S&P has performed in post-OPEX week in November since 1985. It is one of the most bullish post-OPEX weeks in terms of expected return.

This next week is the week before OPEX week. Here is a histogram of the S&P behavior in this week from 1985.

Here is the average DJIA November performance.
All Months: Up 58.0% of the time for an average gain of 0.83%
Election years: Up 50% of the time for an average loss of 0.22%
Year ending in 3: 38.5% for a -0.68% loss
Both prior conditions: Up 33% for an average change of -0.12%.

The DJIA has fallen 9% since the summer top. Here is how the DJIA has reacted after an 9% loss since 1885:

Here is a picture from my old neighborhood in Greenwich Village at Halloween. This is the Cafe Figaro on the corner of Bleecker and McDougall Streets. The Cafe is in its third incarnation. The first one was the meeting place of the artists and writers of the 1950s-1960s.

Post-OPEX week in October has shown only 1 day in the week that has shown a positive expected return and that has been only marginal since 1985. In fact, next week has been the second most bearish week in the year, second only to the 3rd week in September. Expect lower prices

Here is how the S&P behaved in past OPEX weeks in the month of October. This graph is computed to show expected return.

Here is the DJIA October performance:
All Months: Up 56.2% of the time for an average gain of 0.20%
Election years: Up 52.9% of the time for an average loss of 0.54%
Year ending in 3: 61.5% for a 0.73% gain
Both of the prior conditions: Up 50% for an average change of 0.68%.

The important development is the decline in the US bond and foreign bond markets. Prices fell below the 38.2% retracement levels of their entire 1980-2022 bull markets. It has been said that a break of the 38.2% level signals a fundamental shift. Rates are going much higher.

The September weakness has taken over. The technical breakdown in the graph is obvious. The 4300 and 4250 levels are the initial target.

Sell short AutoZone on Monday. The earnings report is likely to be met with selling on Tuesday as suggested by the accurate weekly cycle depicted below.

The average month of September for the AAPL share price is graphed as a daily histogram below. Eighteen of the days in the month have a negative expected return. Price has been down 65% of the time by the end of the month. The last 10 days of the month have been the worst.

The average month of September from 1885 is graphed as a histogram below. Twenty of the days in the month have a negative expected return.

