

We illuminate data, insights, and workflows across the property ecosystem. Formerly CoreLogic.
Australia
Joined December 2008
- Tweets5.7K
- Following27
- Followers31K
- Likes627





We are excited to announce our name change to Cotality, reflecting our expanded solutions and global reach. This shift signifies our evolution into a faster, smarter, and more people-centric company.
Learn more: ow.ly/2pJF50VnMTy

🏡📈 Australia’s regional property values continue to rise faster than the capitals. Get more monthly must-know property metrics from the February Housing Chart Pack. ow.ly/RuPB50UZ5k5
Where will rate cuts make the biggest impact? Discover the key areas to watch in every Australian capital at CoreLogic News. ow.ly/SfLY50UXfxm
Australian home values held steady in January: ow.ly/lZ3Y50US4j1
Sydney 🔻 -0.4%
Melbourne 🔻 -0.6%
Brisbane 🔼 0.3%
Adelaide 🔼 0.7%
Perth 🔼 0.4%
Darwin 🔼 0.6%
Canberra 🔻 -0.5%
#CoreLogicAU #HVI
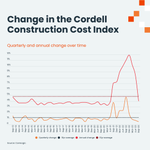
🚧 CoreLogic's latest Cordell Construction Cost Index (CCCI) shows residential construction costs grew 3.4% over 2024. ow.ly/QYsz50UJh7Y
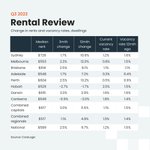
How are renters faring in today’s housing market? Find out in CoreLogic’s latest Quarterly Rental Review. ow.ly/3Tif50UJhbg
The January Housing Chart Pack is now available to download now. ow.ly/5w8k50UE4wW
📉 Australia’s housing market has entered a downturn after nearly two years of consecutive growth. What’s to come of this downswing? CoreLogic’s Head of Research Eliza Owen explains in her latest analysis. ow.ly/vX0N50UCktT
Home value growth falls -0.1% nationally in December: ow.ly/3F1C50Uyth2
Sydney 🔽 -0.6%
Melbourne 🔽 -0.7%
Brisbane 🔺 0.5%
Adelaide 🔺 0.6%
Perth 🔺 0.7%
Hobart 🔽 -0.5%
Darwin 🔺 0.4%
Canberra 🔽 -0.5%
#HVI
CoreLogic’s Best of the Best 2024 reveals the top-performing suburbs across sales, value growth, rental growth, gross yields, and more. ow.ly/vhvu50UqmuW
Home value growth slows to 0.1% nationally in November: ow.ly/70Co50UiFJs
Sydney 🔽 -0.2%
Melbourne 🔽 -0.4%
Brisbane 🔺 0.6%
Adelaide 🔺 0.8%
Perth 🔺 1.1%
Hobart 🔽 -0.1%
Darwin 🔺 0.2%
Canberra 🔺 0.1%
#HVI
Australia’s regional housing markets continue to outperform the capitals. CoreLogic’s latest Regional Market Update is here – dive into the trends now. ow.ly/Hs8P50UhOj4
Home values edged up 0.3% nationally in October.
Sydney 🔽 -0.1%
Melbourne 🔽 -0.2%
Brisbane 🔺 0.7%
Adelaide 🔺 1.1%
Perth 🔺 1.4%
Hobart 🔺 0.8%
Darwin 🔽 -1.0%
Canberra 🔽 -0.3%
Download the latest #HVI now: ow.ly/UL7H50TXKzP
🏗️ Residential construction costs are up 1% over the September quarter. Read more from CoreLogic’s latest #CCCI report: ow.ly/zbcX50TMbcB
New analysis from CoreLogic has identified 65 markets in Sydney and Melbourne where property values are below record highs from the 2010s, and vendors are even willing to sell at a loss... but buyers aren’t interested. 🏘️ Read more: ow.ly/3BlX50TJjqg #CoreLogicAU
National dwelling values increased a modest 0.4% in September: ow.ly/qFMx50TzA9P
Sydney 🔺 0.2%
Melbourne 🔽 -0.1%
Brisbane 🔺 0.9%
Adelaide 🔺 1.3%
Perth 🔺 1.6%
Hobart 🔽 -0.4%
Darwin 🔺 0.1%
Canberra 🔽 -0.3%
#HVI
Australia’s million-dollar property club hit a new peak in August. Find out which suburbs made the list in the full report now available from CoreLogic. ow.ly/BUVl50TwSbt
Are rate hikes done? Tim Lawless explains why RBA’s decision to hold signals a positive outcome. ow.ly/6vXR50TtZiz
Australian property delivered a median nominal gain of $285,000 from resales in the June quarter – setting a record high for the series going back to the early 90s.
The latest Pain & Gain report is now available to download: ow.ly/Itv650TqBAi
Housing affordability has improved in Melbourne, bucking national trends, according to the latest ANZ CoreLogic AustraliaHousing Affordability report. ow.ly/ptVX50TmxYY