

Lets Learn #Python with tips and tricks. Free Python Course: https://xitter.cf/t.co/l9NKxZWrh7 biz : [email protected] AI Community Partner. DM for Everything.
Earth🌎
Joined October 2020
- Tweets17.7K
- Following156
- Followers655K
- Likes1.1K





Most Python developers use pandas for data analysis.
But do you know how to uncover statistical insights with statsmodels?
Learn OLS regression, p-values, R-squared, and confidence intervals with a simple Python example.
Stop just building models. Start understanding the statistics behind them.
Hands-On Statistics for Data Analysis in Python is a comprehensive guide designed for students, professionals, and aspiring data scientists who want to master the essential statistical techniques that drive real-world data analysis.
Books: gumroad.com/products/eqmpdm/


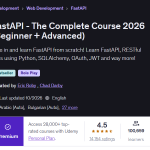
Want to build powerful APIs with Python? Learn FastAPI!
FastAPI is one of the most popular Python frameworks for building modern, high-performance REST APIs.
FastAPI – The Complete Course 2026 (Beginner + Advanced)
What you'll learn:
✅ FastAPI fundamentals from scratch
✅ Build RESTful APIs using Python
✅ Database integration with SQLAlchemy
✅ Authentication with OAuth and JWT
✅ Advanced API development concepts
✅ Practical skills for backend development
Whether you're a beginner or an experienced Python developer, this course can help you strengthen your backend development skills.
Learn FastAPI. Build real-world APIs. Level up your Python skills!
Course details: clcoding.com/2025/12/fastapi…

Python Class Relationships Explained Visually!
Ever wondered how classes are connected in Python?
In this example, Animal is the base class, while Dog and Cat are its child classes.
Key concept: Inheritance
Animal → Parent class
Dog → Child class
Cat → Child class
Both Dog and Cat can inherit attributes and methods from Animal, helping you write reusable, organized code.
Why is inheritance useful?
✅ Code reusability
✅ Better class organization
✅ Easier maintenance
✅ Clear relationships between objects
Challenge: How would you add a Bird class that also inherits from Animal?
Share your answer in the comments!

Can memory help an AI coding agent fix bugs more consistently?
MemT 1.0-Nano puts retrieved coding experience into persistent internal memory to guide later actions.
In the report’s harness-triggered SWE-bench Verified evaluation, average success rose from 66.07% without experience to 69.73%.
But here’s the number that stands out: tasks solved in ALL THREE runs increased from 54% to 62.8%.
That’s an 8.8 percentage-point gain in repeatability—meaning more issues were resolved reliably across repeated attempts.
A practical reason for developers to pay attention to memory-native LLMs.
huggingface.co/collections/M…
🤝 Paid partnership


Can large language models retain information from past interactions and reuse it in the next task?
Introducing MemT-1.0: Towards Memory-Native Evolution.
This time, we've built memory directly into the model architecture.
Our MemT-1.0-Nano and MemT-1.0-Flash make persistent memory part of model computation, carrying information across interactions.

Python Coding Challenge — Day 1286
Can you predict the output of today's Python code without running it?
Test your Python knowledge with this daily coding challenge from CLCODING.
Try solving it yourself before checking the answer!
Challenge link: clcoding.com/2026/10/python-…

Generate a Color Palette Using Python!
Need beautiful color combinations for your next project? Let Python do the work!
With the colour library, you can generate a range of colors from one shade and display them as a visual palette directly in Jupyter Notebook.
What you can learn:
Generate color gradients automatically
Work with HEX color codes
Create custom HTML color swatches
Visualize palettes inside Jupyter Notebook
Unlock the power of Python in the high-tech world of aerospace engineering and satellite data analytics. This comprehensive book provides a hands-on, project-based guide for students, researchers, and professionals working at the intersection of aerospace and data science.
Book: link.amazon/B05ma4lWK

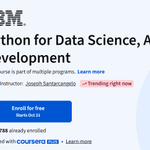
Want to learn Python for Data Science, AI, and Development?
IBM offers a popular course on Coursera that can help you build practical Python skills for the tech industry.
What you'll explore:
Python programming fundamentals
Data Science concepts
AI and Machine Learning foundations
Python for real-world development
With over 1.5 million enrollments, this course is worth exploring if you're starting your journey into Python and AI.
Best part? You can enroll for free!
Start learning today and take your first step toward a career in Data Science, AI, or Software Development.
Detailed Explanation: clcoding.com/2024/11/python-…

FastAPI Tip: Handle Pagination & Filtering Like a Pro!
Did you know you can use Pydantic models to organize query parameters in FastAPI?
With Annotated and Query(), you can build cleaner, more maintainable API endpoints.
In this example, we implement:
✅ Pagination — limit and offset
✅ Filtering — multiple tags in a single request
✅ Search — find items using a search parameter
✅ Validation — enforce constraints with Pydantic's Field()
Example request:
GET /items/?limit=5&offset=0&tags=python&tags=fastapi&search=documentary
Why use this approach?
Cleaner endpoint signatures
Reusable validation models
Better organization of API parameters
Easier-to-maintain backend code
Build smarter APIs with Python and FastAPI!
What are you building with FastAPI? 👇
Follow @clcoding for more Python tutorials, coding tips, and backend development resources.

Sacred Mandala Art — A Beautiful Blend of Nature, Patience & Creativity!
Watch this turtle-inspired mandala art come to life, one intricate pattern at a time.
Every detail reflects patience, balance, and the beauty of artistic expression.
Sometimes, the most beautiful creations come from taking things one step at a time.
Would you try creating this mesmerizing design? 👇
Code: clcoding.com/2026/10/python-…
Python vs Cython: The Same Logic, Over 100× Faster!
Did you know that Cython can dramatically speed up Python code?
In this benchmark:
Pure Python: 7.37 seconds
With Cython: 59.5 milliseconds
That's approximately 124× faster!
What makes the difference?
✅ C-level variable declarations with cdef
✅ Compiled code instead of relying entirely on Python's runtime
✅ Reduced overhead in performance-critical loops
Pro tip: If your Python code spends significant time in numerical loops, Cython is worth exploring.
Results depend on the code, types, compiler settings, and hardware. Not every Python program will achieve this speedup.
Would you try Cython to optimize your Python applications?
Repost to help other Python developers discover this!
Follow @clcoding for more Python tips, coding challenges, and developer resources.
Blog: clcoding.com/2026/10/python-…

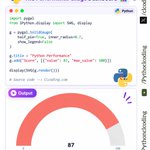
The Performance Gauge Dashboard using Python!
Want to visualize performance scores with a beautiful gauge chart?
With Python’s pygal library, you can create a clean and interactive-looking dashboard in just a few lines of code.
In this example:
Create a half-circle gauge chart.
Display a performance score of 87 out of 100.
Customize the chart title and appearance.
Render the visualization directly in Jupyter Notebook using SVG.
Libraries used: pygal and IPython.display
100 Days of Math with Python is a comprehensive project-based learning journey designed to bridge the gap between mathematical thinking and Python programming. From fundamental arithmetic operations to advanced topics such as machine learning mathematics, optimization, cryptography, numerical methods, and graph theory, this book provides a structured roadmap for mastering mathematics through code.
Books: link.amazon/B0ftQMP60

Writing Python code is easy. Debugging it is the real challenge!
Your code looks perfect. No syntax errors. The logic seems correct.
Then you run the tests… ❌
You add more tests… ❌
You investigate the issue… ❌
And finally, you discover the bug was in the test itself!
The lesson?
Don't assume your code is always wrong.
Validate your test cases.
Check edge cases and expected outputs.
Debug both your code and your tests.
Remember: Tests can have bugs too!
Free PDF Book Access:
Deep Learning on Graphs (Free PDF)
clcoding.com/2026/07/deep-le…

9/ Want to learn data visualization with Python?
Start with Matplotlib, then learn Plotly.
Understand the fundamentals first. Then build interactive dashboards using real datasets.
8/ The real lesson
A chart shouldn't just display numbers.
It should help people discover patterns, investigate outliers, and answer questions.
Static charts communicate insights.
Interactive charts invite exploration.
7/ Build interactive business dashboards
Plotly is useful for analyzing:
• Sales and revenue
• Website traffic
• Customer behavior
• Financial data
• Machine learning results
Use Plotly with Dash or Streamlit to build full data applications.

6/ Add more information to hover tooltips
You can display multiple metrics on the same chart.
df["visitors"] = [900, 980, 950, 1250, 1180]
fig = px.line(
df,
x="month",
y="sales",
hover_data=["visitors"],
markers=True
)
fig.show()
Now you can inspect sales and website visitors together.

5/ What makes this chart special?
Unlike a basic static image, your Plotly chart lets you:
→ Hover over points to inspect values
→ Zoom into specific sections
→ Pan across the chart
→ Reset the view whenever needed
Your users can explore the data themselves.

4/ Create your first interactive chart
Install the required libraries:
%pip install pandas plotly
Then create a chart:
import pandas as p
import plotly.express as px
df = pd.DataFrame({
"month": ["Jan", "Feb", "Mar", "Apr", "May"],
"sales": [120, 135, 128, 190, 175]
})
fig = px.line(
df, x="month", y="sales",
markers=True,
title="Monthly Sales"
)
fig.show()
