

A Scorpio that feels like the 🌎 is hers..🫴🏽 👩🏽💻| If you’re an unpopular opinion hater, follow me.
Joined May 2014
- Tweets10.7K
- Following1.6K
- Followers2K
- Likes15.9K



C.🫰🏽™️ retweeted

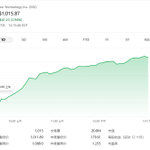
🚨 Micron Technology ($MU): From $1,254 to $915—a "buy the dip" opportunity, or just a pause in a downward trend?
As a core stock in the AI memory sector, Micron has pulled back nearly 27% following a meteoric rise. Bulls and bears are currently battling near the $900 level—a standoff that could determine whether the rebound continues over the next few sessions.
📊 I. Fundamentals: AI Memory Remains the Core Thesis
Micron (MU) stands to benefit from growing demand for AI servers, High-Bandwidth Memory (HBM), and DRAM. As investment in AI infrastructure continues, the importance of high-performance memory only grows.
However, keep in mind: the memory industry is highly cyclical. Profitability is sensitive to shifts in supply and demand, product pricing, gross margins, and capital expenditures. Strong financial results do not guarantee a rising stock price; if the market has already "priced in" future growth, valuations may still face downward pressure.
📉 II. Technicals: Key Price Levels to Watch
According to the charts, MU peaked at approximately $1,254.61 before pulling back to the $915 level. In the short term, the stock is in a recovery phase following a high-level correction.
🔹 $900–$915: The Bull-Bear Pivot. Holding this zone could allow for continued consolidation and base-building; a decisive breakdown, however, would signal the risk of further decline.
🔹 $880–$850: Downside Support. If the $900 level fails, this zone becomes a critical area to monitor—though one should not assume an automatic rebound upon reaching it.
🔹 $930–$950: Initial Resistance. Reclaiming this range is essential for improving the short-term technical structure.
🔹 $980–$1,000: Key Breakout Level. A breakout on high volume—followed by stabilization—could open the door for further upside.
🔹 $1,050–$1,100: Major Overhead Resistance. Even if a rebound takes hold, be wary of selling pressure from investors who bought in earlier at higher prices (trapped longs) or those looking to lock in profits. 🎯 III. Short-Term Trading Strategy
✅ Bullish Scenario: Support near $900 holds; a breakout above the $930–$950 range—accompanied by increased volume—would point toward the $980–$1000 level.
⚠️ Range-Bound Scenario: If the price oscillates repeatedly between $900 and $930, exercise caution when chasing gains and avoid adding to positions without a clear plan.
❌ Bearish Scenario: A decisive breakdown below $900—without a subsequent recovery—shifts focus to the $880–$850 zone; assess your position risk accordingly.
💡 IV. Look Beyond Just the Stock Price!
Key factors to monitor moving forward: 1️⃣ HBM demand and investment trends in AI servers; 2️⃣ Price, supply, and demand dynamics for DRAM/NAND; 3️⃣ Gross margins, earnings guidance, and capital expenditures; 4️⃣ Whether price breakouts are supported by a surge in trading volume.
Conclusion: While the long-term thesis for Micron (MU) in the AI memory space is compelling, short-term price action requires further confirmation. Watch for support at $900, potential rebounds between $930–$950, and a possible breakout toward $980–$1000. Do not assume a stock is "cheap" simply because it has fallen 27%, and do not overlook the risk of pullbacks just because the fundamentals appear strong.
📌 The price levels mentioned above are estimates based on chart analysis and are provided for research purposes only; they do not constitute investment advice. Market conditions may shift, rendering these key levels obsolete.
#Keywords: #MicronTechnology #MU #MicronStock #USStockAnalysis #AIStocks #HBM #MemoryChips #Semiconductors #DRAM #NAND #TechnicalAnalysis #USStockInvesting #AIComputingPower #StockTradingStrategy


🚨Wall Street’s calm can be deceiving. Diversification works, but only when different stocks don’t all move in the same direction. Here are 5 stocks I’m watching today: Bookmark this 📷<🔥
$MU

C.🫰🏽™️ retweeted
🚨Wall Street’s calm can be deceiving. Diversification works, but only when different stocks don’t all move in the same direction. Here are 5 stocks I’m watching today: Bookmark this 📷<🔥
$MU
C.🫰🏽™️ retweeted

Semiconductor stocks faced heavy selling last week, but risk appetite improved on Monday as Treasury yields eased and oil prices fell. Meanwhile, investors are closely watching earnings from Tesla and other major tech companies this week.
💵 $NVDA +1.38% 👇


🚨 10 AI & Tech Stocks I’m Watching Next Week.
I’m breaking down the key support levels, resistance zones, and potential breakout setups for all 10 names:
1. $NVDA — AI chip leadership & key resistance
C.🫰🏽™️ retweeted
🚨 META Pulls Back Nearly 10% After Surge! The $700 Level Could Determine the Direction of the Next Market Move!
Is Meta Platforms ($META) a "buy the dip" opportunity, or the beginning of a deeper correction?
As of October 19, 2026, META is trading at $706, down 0.71% for the day. The stock has retreated approximately 9.7% from its recent high of $779.82. Following a rapid rally, bulls and bears are now battling at a critical juncture.
📊 I. Technical Analysis: Keep an Eye on These Key Levels!
🔹 $693–700: The "Lifeline" – Currently the most vital support zone. If the stock holds this area and regains a firm footing above $720, the short-term rebound could continue; a decisive breakdown, however, would increase the risk of a further correction.
🔹 $720–740: Rebound Confirmation Zone – Reclaiming this range would suggest that buying momentum is returning. Watch for potential resistance near $760.
🔹 $760–780: Strong Resistance Zone – Profit-taking pressure is likely near these previous highs. A breakout above $779.82—backed by high volume—would provide a clearer signal of a move to new highs.
🔹 $670–685: Lower Support Watch – If the $693–700 level fails, this range could serve as the next area of support. Should weakness persist, look toward the $640–660 zone.
💰 II. Fundamentals: Is the Valuation Expensive?
Based on the market data provided: • Market Cap: ~$1.79 trillion • P/E Ratio (TTM): 26.53x • Forward P/E: 23.47x • Dividend Yield: 0.30% • Beta: 1.44
This implies that the investment thesis for META shouldn't rely solely on share price movements; rather, investors should focus on whether earnings growth can justify the current valuation and whether investments in AI will translate into long-term returns. The price-to-earnings (P/E) ratio alone cannot determine whether a stock is "cheap"; earnings expectations are equally critical.
⚠️ 3. The real test is just around the corner!
As shown in the screenshot, META is scheduled to release its earnings report after the market closes on October 21. Key areas to watch include growth in the advertising business, spending on AI infrastructure, capital expenditure plans, and management guidance.
Keep an eye on the following: ✅ Holding the $700 level and reclaiming $720: Watch to see if the rebound can be sustained. ⚠️ Falling below $693 without a recovery: Beware of a deepening pullback. 🔥 A breakout above $740 on high volume: This could improve the short-term outlook. 📉 Earnings missing expectations or weak guidance: The stock may remain under pressure, even if its valuation appears reasonable.
My take: There’s no need to rush to "call the bottom" right now. First, see if the $700 support level holds, then watch to see if the stock can reclaim the $720–$740 range. Expect increased volatility around the earnings release; making decisions in stages and managing your position size is far more prudent than blindly "buying the dip."
Do you think META will head toward $760 next, or pull back to $680? 👇
#META #MetaPlatforms #USStocks #USStockInvesting #TechStocks #AIInvesting #StockAnalysis #TechnicalAnalysis #SupportLevel #EarningsSeason #NASDAQ #MetaStock

🚨 The AI sector watchlist for Monday is ready. After a brutal week for tech stocks, a single green candle is not enough to convince me that the sell-off is over.
Here is what I’m keeping a close eye on heading into the market open:
🔹 $NVDA — Friday’s price action hovered near the $213–$215 support zone, with $216–$220 serving as the initial area for a potential rebound. Holding support and reclaiming these resistance levels would improve the technical setup; conversely, a breakdown below support puts the $208–$210 range—or even $200–$205—in focus.
🔹 $AMD and $AVGO — Watch to see if these semiconductor bellwethers can stabilize. If the broader sector continues to face selling pressure, any rebound in individual stocks is unlikely to be sustainable.
🔹 $MU — Demand for memory chips remains tightly linked to AI infrastructure development, but I’ll be looking at price action and volume to confirm whether buyers have truly returned.
🔹 $CRWV, $IREN, and $NBIS — It’s essential to scrutinize these companies’ financing situations, capital expenditures, debt levels, and their paths toward achieving sustainable cash flow.
🔹 $META and $TSLA — Upcoming earnings reports may provide fresh clues regarding growth expectations, AI investments, and overall market sentiment toward Big Tech.
My watchlist focuses on the Nasdaq’s trajectory, U.S. Treasury yields, opening volume, and whether key support levels hold. If the market gaps down below these support levels, I will re-evaluate my technical outlook rather than assuming my previous analysis still holds true.
My goal isn’t to predict every single fluctuation, but to identify moments where the risk-to-reward ratio begins to improve—and to determine if the original investment thesis is still valid.
Which stock do you think is most worth watching closely this week?
I track these developments daily and share the setups, catalysts, and key price levels within my free community. If you would like to join, please reply "Yes"
#NVDA #AMD #AVGO #MU #CRWV #IREN #NBIS #AIStocks
RT @Thomas00g7: 🚨 A Critical Moment for NVIDIA (NVDA)! Is $219 the Starting Point for a Rebound, or Just a Pause in a Downtrend? Keep an Ey…
This quoted post is unavailable.
C.🫰🏽™️ retweeted
🚨 MU: Micron’s Next Big Move Starts at $900. Breakout or Breakdown?
Micron Technology ($MU) surged from roughly $295 to an all-time chart high of $1,254.61 before pulling back nearly 27%. Now trading around $910, MU is approaching a critical battleground where bulls and bears could determine the next major trend. 👀
📊 KEY TECHNICAL LEVELS TO WATCH
🟢 $880–900 | Immediate Support
The key zone bulls need to defend. Holding this area and bouncing with stronger volume could signal a potential short-term base.
🟢 $820–850 | Secondary Support
If $880 breaks decisively, this is the next important demand zone to watch.
🔴 $970–1,000 | First Resistance
A sustained, volume-backed breakout could open the door to a stronger recovery.
🔴 $1,050–1,100 | Major Resistance
Previous rebound highs create a significant supply zone. Bulls need convincing momentum to break through.
🎯 $1,254.61 | Previous Peak
A longer-term reference point, but reclaiming it would require substantial upside momentum.
🧠 FUNDAMENTALS: THE AI MEMORY OPPORTUNITY
Micron is a key player in DRAM, NAND, and high-bandwidth memory (HBM)—technologies central to AI infrastructure and data-center expansion.
Key catalysts to monitor: • HBM demand and production capacity
• DRAM and NAND pricing trends
• Gross margins, capital spending, and free cash flow
• Earnings guidance and future demand expectations
The chart’s displayed valuation shows a trailing P/E of approximately 12.26x and a forward P/E of 5.24x. While this may look attractive, memory-chip earnings are cyclical. Lower forward multiples are only meaningful if projected profits prove sustainable.
📈 THE BULL CASE: Hold $900, reclaim $1,000, and challenge $1,050–1,100.
📉 THE BEAR CASE: Lose $880, opening the possibility of a deeper pullback toward $820–850.
My focus: Watch $900 for support and $1,000 for confirmation. Don’t confuse a one-day bounce with a confirmed trend reversal. Volume, earnings, and memory pricing will matter.
⚠️ Technical analysis only—not financial advice. Manage risk and verify current market data before trading.
#MU #Micron #MicronTechnology #Semiconductors #AIStocks #HBM #MemoryChips #NASDAQ #StockMarket #TechnicalAnalysis #Earnings #Investing

🚨 The AI sector watchlist for Monday is ready. After a brutal week for tech stocks, a single green candle is not enough to convince me that the sell-off is over.
Here is what I’m keeping a close eye on heading into the market open:
🔹 $NVDA — Friday’s price action hovered near the $213–$215 support zone, with $216–$220 serving as the initial area for a potential rebound. Holding support and reclaiming these resistance levels would improve the technical setup; conversely, a breakdown below support puts the $208–$210 range—or even $200–$205—in focus.
🔹 $AMD and $AVGO — Watch to see if these semiconductor bellwethers can stabilize. If the broader sector continues to face selling pressure, any rebound in individual stocks is unlikely to be sustainable.
🔹 $MU — Demand for memory chips remains tightly linked to AI infrastructure development, but I’ll be looking at price action and volume to confirm whether buyers have truly returned.
🔹 $CRWV, $IREN, and $NBIS — It’s essential to scrutinize these companies’ financing situations, capital expenditures, debt levels, and their paths toward achieving sustainable cash flow.
🔹 $META and $TSLA — Upcoming earnings reports may provide fresh clues regarding growth expectations, AI investments, and overall market sentiment toward Big Tech.
My watchlist focuses on the Nasdaq’s trajectory, U.S. Treasury yields, opening volume, and whether key support levels hold. If the market gaps down below these support levels, I will re-evaluate my technical outlook rather than assuming my previous analysis still holds true.
My goal isn’t to predict every single fluctuation, but to identify moments where the risk-to-reward ratio begins to improve—and to determine if the original investment thesis is still valid.
Which stock do you think is most worth watching closely this week?
I track these developments daily and share the setups, catalysts, and key price levels within my free community. If you would like to join, please reply "Yes"
#NVDA #AMD #AVGO #MU #CRWV #IREN #NBIS #AIStocks
C.🫰🏽™️ retweeted
🚨 AI stocks are bouncing back this Monday.
$NVDA +0.6%
$AMD +4.3%
$MU +4.2%
$AVGO +2.3%
$TSLA ~+1.7%
$SNDK +6.6%
$NBIS +4%
$IREN +5.2%
$CRWV +3%
After last week's brutal selloff, is this a real recovery or just a relief bounce?
#AIStocks #Semiconductors #NVDA #AMD #TechStocks
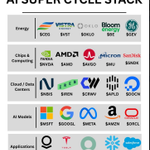
🚨 10 AI & Tech Stocks I’m Watching Next Week.
I’m breaking down the key support levels, resistance zones, and potential breakout setups for all 10 names:
1. $NVDA — AI chip leadership & key resistance
C.🫰🏽™️ retweeted
🚨 The AI sector watchlist for Monday is ready. After a brutal week for tech stocks, a single green candle is not enough to convince me that the sell-off is over.
Here is what I’m keeping a close eye on heading into the market open:
🔹 $NVDA — Friday’s price action hovered near the $213–$215 support zone, with $216–$220 serving as the initial area for a potential rebound. Holding support and reclaiming these resistance levels would improve the technical setup; conversely, a breakdown below support puts the $208–$210 range—or even $200–$205—in focus.
🔹 $AMD and $AVGO — Watch to see if these semiconductor bellwethers can stabilize. If the broader sector continues to face selling pressure, any rebound in individual stocks is unlikely to be sustainable.
🔹 $MU — Demand for memory chips remains tightly linked to AI infrastructure development, but I’ll be looking at price action and volume to confirm whether buyers have truly returned.
🔹 $CRWV, $IREN, and $NBIS — It’s essential to scrutinize these companies’ financing situations, capital expenditures, debt levels, and their paths toward achieving sustainable cash flow.
🔹 $META and $TSLA — Upcoming earnings reports may provide fresh clues regarding growth expectations, AI investments, and overall market sentiment toward Big Tech.
My watchlist focuses on the Nasdaq’s trajectory, U.S. Treasury yields, opening volume, and whether key support levels hold. If the market gaps down below these support levels, I will re-evaluate my technical outlook rather than assuming my previous analysis still holds true.
My goal isn’t to predict every single fluctuation, but to identify moments where the risk-to-reward ratio begins to improve—and to determine if the original investment thesis is still valid.
Which stock do you think is most worth watching closely this week?
I track these developments daily and share the setups, catalysts, and key price levels within my free community. If you would like to join, please reply "Yes"
#NVDA #AMD #AVGO #MU #CRWV #IREN #NBIS #AIStocks
C.🫰🏽™️ retweeted
🚨 10 AI & Tech Stocks I’m Watching Next Week.
I’m breaking down the key support levels, resistance zones, and potential breakout setups for all 10 names:
1. $NVDA — AI chip leadership & key resistance
📈 A watchlist is a starting point. Understanding the setup is what matters.
My partners and I built a free stock discussion community where we break down active stocks, market trends, and the key levels worth watching. Inside, we share:
• Daily watchlists and market updates
• Stock research and technical analysis
• Support, resistance, and potential setups
• Trading plans with clear risk considerations It’s a place to compare notes, ask questions, and learn alongside other investors.
Free to join. No hidden fees. No pressure. Interested? Comment “Yes” below and I’ll send you an invite. 📷 #Stocks #StockMarket #Trading

C.🫰🏽™️ retweeted
🚨 AI stocks just had one of their toughest weeks since June. But is the AI trade actually breaking—or is Wall Street finally asking the right questions?
The Nasdaq plunged 4.5% this week, while the S&P 500 lost roughly 1.9%. The Dow gained 0.7%, showing just how sharply market leadership has shifted.
Here’s what matters: the selloff isn’t simply about whether AI demand exists. Investors are questioning how much companies are spending, how that spending is financed, and how quickly it can turn into sustainable earnings and cash flow.
C.🫰🏽™️ retweeted
$NVDA is approaching a make-or-break level. Is this a healthy pullback—or the start of a deeper correction?
$NVDA is trading near $214, down 1.40%, after retreating from its recent high of $243.37. The key battle is now between $213–215 support and the $216–220 recovery zone.
Here’s what matters next:
📍 $213–215: Critical near-term support. Holding this zone could stabilize the pullback.
📍 $208–210: First downside target if support breaks.
📍 $200–205: Major support zone where buyers may attempt to defend the broader structure.
📍 $216–220: First recovery hurdle. Reclaiming this area would improve short-term momentum.
📍 $225–230: Major resistance. A breakout with stronger volume could signal renewed strength.
📍 $240–243: Key overhead resistance, with $243.37 marking the recent high.
Fundamentally, $NVIDIA remains at the center of the AI infrastructure buildout. Data-center GPUs, networking, and the CUDA ecosystem remain key competitive advantages. The screenshot shows a market cap of approximately $5.16T, a trailing P/E of 27.08, and a forward P/E of 17.43. Those figures reflect market expectations, but sustained growth and future earnings delivery still matter.
My focus: Can buyers defend $213–215 and reclaim $220, or will sellers push $NVDA toward $208 and potentially $200?
Price action, volume, and earnings expectations will determine the next move. Which level are you watching?
#NVDA #NVIDIA #AIStocks #Semiconductors #AIInfrastructure #DataCenter #TechStocks #StockMarket

🔥 The Tesla Roadster story is getting wild.
But I’m not only watching Tesla.
The bigger opportunity may be the entire technology ecosystem developing around AI, computing, energy, storage and space.
My current watchlist:
$TSLA
$NVDA
$MU
$SPCX
$CRWV
$META
$SNDK
Different companies. Different catalysts.
Same question:
Which ones are actually setting up before the next move?
I’m tracking them every day and sharing the setups, catalysts and key levels inside my free group.
Comment “Yes” if you want access.
C.🫰🏽™️ retweeted
$META just hit a level where the next move could matter more than the last one.
After running to a YTD high of $779.82, $META has pulled back to around $717, putting the stock directly into a critical technical zone.
The first level I’m watching is $710–$720. As long as buyers defend this area, the recent pullback can still be viewed as consolidation after a major breakout. A reclaim of $725–$730 would be the first sign that momentum is stabilizing, while a move back above $740–$745 would strengthen the bullish setup.
Above $745, attention shifts to $760–$780, with $779.82 as the key breakout level. A sustained move above $780 could open the door to another momentum leg.
But there’s a clear risk line too: losing $710 would weaken the setup and put $680–$690 back on the radar as the next major support zone.
Fundamentally, $META still has a powerful AI-driven growth story behind it. The company is investing aggressively in AI infrastructure, models and products, while the market is also looking ahead to its upcoming earnings catalyst. The chart shows a high-volatility range, so price confirmation matters more than chasing strength.
At roughly $717, $META is sitting at a decision point: defend support and reclaim resistance, or risk a deeper reset.
Which level do you think breaks first?
#META #MetaPlatforms #AIStocks #TechStocks #BigTech #AIEarnings #Nasdaq #GrowthStocks

🔥 The Tesla Roadster story is getting wild.
But I’m not only watching Tesla.
The bigger opportunity may be the entire technology ecosystem developing around AI, computing, energy, storage and space.
My current watchlist:
$TSLA
$NVDA
$MU
$SPCX
$CRWV
$META
$SNDK
Different companies. Different catalysts.
Same question:
Which ones are actually setting up before the next move?
I’m tracking them every day and sharing the setups, catalysts and key levels inside my free group.
Comment “Yes” if you want access.
C.🫰🏽™️ retweeted
$SNDK is getting interesting at a very different level than it was near the highs.
The stock is around $1,336, down 4.17%, after a sharp pullback from the recent $1,800–$1,900 area. Technically, $1,320–$1,340 is the key battleground. Hold that zone and a rebound toward $1,400–$1,420 becomes possible. A clean reclaim of $1,420 would put $1,500–$1,600 back in focus, while $1,750–$1,800 remains the next major resistance. Above $1,880–$1,900, the broader recovery structure would become much more convincing.
The fundamental story is still worth watching. Sandisk finished FY2026 with $20.25B in revenue, up 175% YoY, while datacenter revenue jumped 437% to $5.15B. Management guided FY2027 Q1 revenue to $10.3B–$10.8B and non-GAAP EPS to $44–$46. Sandisk Corporation
The valuation shown on the chart is also notable: roughly 18.1x trailing P/E versus 5.83x forward P/E, with a market cap near $194B. But the beta around 2.84 shows just how aggressive the price action can be.
The next major catalyst is earnings on October 29. Sandisk Corporation
For me, the setup is simple: $1,320–$1,340 must hold. Lose it, and $1,200–$1,250 becomes the next downside zone. Reclaim $1,420 with stronger volume, and the entire setup starts looking very different.
#SNDK #SanDisk #NAND #Semiconductors #AI #DataCenter #AIInfrastructure #MemoryStocks #TechStocks #StockMarket

🔥 The Tesla Roadster story is getting wild.
But I’m not only watching Tesla.
The bigger opportunity may be the entire technology ecosystem developing around AI, computing, energy, storage and space.
My current watchlist:
$TSLA
$NVDA
$MU
$SPCX
$CRWV
$META
$SNDK
Different companies. Different catalysts.
Same question:
Which ones are actually setting up before the next move?
I’m tracking them every day and sharing the setups, catalysts and key levels inside my free group.
Comment “Yes” if you want access.
C.🫰🏽™️ retweeted
🔥 The Tesla Roadster story is getting wild.
But I’m not only watching Tesla.
The bigger opportunity may be the entire technology ecosystem developing around AI, computing, energy, storage and space.
My current watchlist:
$TSLA
$NVDA
$MU
$SPCX
$CRWV
$META
$SNDK
Different companies. Different catalysts.
Same question:
Which ones are actually setting up before the next move?
I’m tracking them every day and sharing the setups, catalysts and key levels inside my free group.
Comment “Yes” if you want access.
If you follow the stock market but hate the noise, this page is for you.
I focus on the things that actually move stocks:
• AI & semiconductors
• Earnings & catalysts
• Breakout setups
• Support & resistance
• Energy & infrastructure
• Growth stocks with real momentum
• Market trends before they become obvious
I’m not here to post 50 tickers a day.
I’d rather find a few setups worth watching, explain the levels that matter, and tell you what would confirm or invalidate the idea.
Some trades will work.
Some won’t.
But the goal is always the same:
See the setup earlier.
Understand the risk better.
Ignore the noise.
Follow now. The next setup may already be forming.

C.🫰🏽™️ retweeted
The market isn't questioning whether $META can grow. It's questioning what that growth will cost.
At $736.72, Meta sits between strong ad demand and a massive AI spending cycle. Q2 revenue climbed 28% to $60.8B, but operating profit fell 8% as infrastructure costs surged. That's the trade-off investors are pricing in.
📊 Key Levels:
🟢 Support: $715–720
🔴 Resistance: $740–745
🎯 Breakout Zone: $760–780
A breakout on strong volume could revive momentum. Lose $715, and $680–690 comes into focus.
With earnings approaching, can AI monetization catch up with spending?
#META #AIStocks #BigTech #StockMarket #Earnings

🚀 8 STOCKS I'M WATCHING BEFORE OCTOBER 30!
The next big move won't come from chasing every green candle. It's about finding the right setup before momentum takes off.
📈 My current watchlist:
🔥 $SNDK — Strong momentum, but I'm not chasing at these levels.
🔥 $META — Great business. Patience matters more than FOMO.
🔥 $INTC — Watching for a breakout with real volume.
🔥 $TSLA — A momentum play worth keeping on the radar.
🔥 $RKLB — One of my favorite space-sector names to monitor.
🔥 $BE — AI power demand could keep this story interesting.
🔥 $MU — The memory-chip cycle deserves serious attention.
🔥 $NVDA — Still a key name for tracking the broader AI trade.
The biggest mistake? Buying the hype without a plan.
People keep asking why I share my research for free.
Simple. I love the markets, and I enjoy helping other investors spot opportunities.
🎯 Want my entry zones, price targets, and risk levels?
Comment "YES" below, and I'll send you details about my FREE investment community.
#Stocks #StockMarket #AIStocks #Investing
C.🫰🏽™️ retweeted
🚨 $SNDK — A 41% pullback doesn't mean the AI storage story is over.
SanDisk trades near $1,395 after peaking at $2,354.
AI data centers, enterprise SSD demand, and NAND pricing remain key growth drivers. Forward P/E sits near 6x, but memory cycles carry real risks.
📊 Key Levels:
🟢 Support: $1,276–1,340
🔴 Resistance: $1,400–1,450
🎯 Breakout Zone: $1,500–1,600
Reclaiming $1,450 could revive momentum. Losing $1,276 risks a deeper correction.
Is this a buying opportunity or a bull trap?
#SNDK #SanDisk #AIStocks #NAND #Semiconductors #TechStocks #StockMarket

🚀 8 STOCKS I'M WATCHING BEFORE OCTOBER 30!
The next big move won't come from chasing every green candle. It's about finding the right setup before momentum takes off.
📈 My current watchlist:
🔥 $SNDK — Strong momentum, but I'm not chasing at these levels.
🔥 $META — Great business. Patience matters more than FOMO.
🔥 $INTC — Watching for a breakout with real volume.
🔥 $TSLA — A momentum play worth keeping on the radar.
🔥 $RKLB — One of my favorite space-sector names to monitor.
🔥 $BE — AI power demand could keep this story interesting.
🔥 $MU — The memory-chip cycle deserves serious attention.
🔥 $NVDA — Still a key name for tracking the broader AI trade.
The biggest mistake? Buying the hype without a plan.
People keep asking why I share my research for free.
Simple. I love the markets, and I enjoy helping other investors spot opportunities.
🎯 Want my entry zones, price targets, and risk levels?
Comment "YES" below, and I'll send you details about my FREE investment community.
#Stocks #StockMarket #AIStocks #Investing
C.🫰🏽™️ retweeted
🚨 $MU — Micron is approaching a critical technical zone. Here's what I'm watching.
Micron is trading near $922 after pulling back sharply from its $1,254 high. The bigger trend has been impressive, but short-term momentum is weakening.
📊 Key Levels:
🟢 Support: $900
🟢 Major Support: $850–$870
🔴 Resistance: $1,000
🔴 Major Resistance: $1,050–$1,100
Fundamentally, Micron remains a major player in AI infrastructure, with HBM and DRAM demand driving its growth outlook.
The chart platform shows a trailing P/E of 12.33 and a forward P/E of 5.27. Attractive on paper, but memory earnings are cyclical, so execution matters.
My take: Holding $900 keeps the recovery scenario alive. Reclaiming $1,000 with strong volume could shift momentum back toward the bulls. A break below $850 would raise downside risk.
The next move could be important.
💬 Are you buying this pullback or waiting for confirmation?
#MU #Micron #AIStocks #Semiconductors #HBM #DRAM #TechStocks #StockMarket

🇳🇴 This place looks like something straight out of a fairytale! 😍
Welcome to Bergen, Norway — where colorful waterfront houses meet breathtaking mountains and crystal-blue fjords. 🏔️🌊
Imagine waking up here, grabbing a coffee, and watching the world go by without a worry in sight.
No rush. No noise. Just pure Scandinavian magic. ✨
Be honest… would you spend a month here if money wasn't an issue? 👀❤️
#Norway #Bergen #TravelGoals #BucketList #BeautifulDestinations

C.🫰🏽™️ retweeted
🚀 8 STOCKS I'M WATCHING BEFORE OCTOBER 30!
The next big move won't come from chasing every green candle. It's about finding the right setup before momentum takes off.
📈 My current watchlist:
🔥 $SNDK — Strong momentum, but I'm not chasing at these levels.
🔥 $META — Great business. Patience matters more than FOMO.
🔥 $INTC — Watching for a breakout with real volume.
🔥 $TSLA — A momentum play worth keeping on the radar.
🔥 $RKLB — One of my favorite space-sector names to monitor.
🔥 $BE — AI power demand could keep this story interesting.
🔥 $MU — The memory-chip cycle deserves serious attention.
🔥 $NVDA — Still a key name for tracking the broader AI trade.
The biggest mistake? Buying the hype without a plan.
People keep asking why I share my research for free.
Simple. I love the markets, and I enjoy helping other investors spot opportunities.
🎯 Want my entry zones, price targets, and risk levels?
Comment "YES" below, and I'll send you details about my FREE investment community.
#Stocks #StockMarket #AIStocks #Investing
🚨 Looking for better stock ideas and real market discussions?
I run a FREE investing community with my partners where we share:
📈 Daily stock watchlists
🎯 Potential breakout opportunities
📊 Market analysis and key price levels
🔥 AI, tech, and high-growth stocks
💡 Trading strategies and risk management
No fees. No hype. No pressure.
Just investors sharing ideas, spotting opportunities, and getting better together.
Interested? Drop a “YES” below and I’ll send you an invite! 👇
#Stocks #StockMarket #Investing

