

Transdisciplinary research+data center of @columbiaclimate studying human-environment interactions. Free data, map svcs+tools. Our main program is NASA SEDAC.
- Tweets2.9K
- Following166
- Followers1.7K
- Likes1.6K







ALT This image features a view of New York City's Times Square looking south in early evening. The right, left, and middle background of the image shows office buildings, skyscrapers, and stores with bright lights and advertising signs surrounding the square. The center of the image shows cars and people traversing the streets and sidewalks below. Image Credit: Terabass/Wikipedia

ALT NASA/NOAA Suomi National Polar-orbiting Partnership (Suomi NPP) VIIRS Version 2 Land Surface Temperature and Emissivity data over Sudan and South Sudan on December 13, 2022. Map displays Land Surface Temperature (LST) in units of Kelvin (K). The color ramp is from red to blue where red represent higher LST values and blue represents the lower values. Areas with high water concentrations, including the White and Blue Nile Rivers, as well as vegetated areas, including area around the Nuba Mountains, display as shades of blue while surrounding barren landscapes display in yellows and reds.


ALT Panel Discussion: Advancing Institutional Capacity to Reduce Social, Environmental, and Economic Vulnerability in Climate Migrant Receiving Communities


ALT This image mosaic features several different NASA datasets in the background in a series of interconnected circular graphics.


ALT Global Land Cover Mapping and Estimation (GLanCE) Yearly 30 m Version 1 Data showing Enhanced Vegetation Index near Venice, Italy in July, 2018.





ALT Columbia Climate Imaginations Network Spring Festival

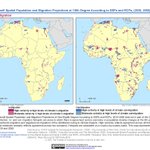
ALT On the left, map of Africa shows"hotspots"--high concentration areas-- of in-migration population and migration projections; on the right, Africa map shows out-migration projections.
