

Trusted US visa slot tracker 🇺🇸 | Crowdsourced updates + instant alerts for H, F & B visas | Reliable appointment booking support | Never miss an opening
- Tweets923
- Following35
- Followers11.5K
- Likes227

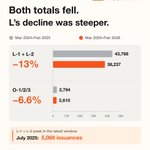




ALT L and O visas issued to Indian nationals worldwide, wherever they applied. March 2025–February 2026 versus March 2024–February 2025: L-1+L-2, 38,237 versus 43,768 (−13%); O-1+O-2+O-3, 2,610 versus 2,794 (−6.6%). Latest/prior component counts: L-1 17,420/20,299; L-2 20,817/23,469; O-1 1,541/1,647; O-2 519/587; O-3 550/560. Grey is prior and orange is latest, on one zero-based 0–50,000 scale. Changes are calculated from summed counts. Secondary insight: combined L-1/L-2 issuances peaked in July 2025 at 5,068 within the latest window. Data through February 2026, inclusive. Source: https://checkvisaslots.com/us-visa-statistics/in/#what-the-visas-are-for Issuance counts do not measure appointment availability or individual approval chances.

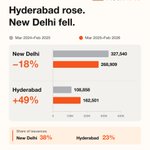
ALT B1/B2 visas issued at US consulates in India, all nationalities. Mar 2025–Feb 2026 compared with Mar 2024–Feb 2025: New Delhi, 268,909 versus 327,540, −18%; approximately 38% of latest-period issuances. Hyderabad, 162,501 versus 108,858, +49%; approximately 23% of latest-period issuances. Grey bars show the previous period; orange bars show the latest period, on one zero-based 0–400,000 scale. Data through February 2026. Source: https://checkvisaslots.com/us-visa-statistics/in/b1b2/ Issuance counts do not measure appointment availability or individual approval chances.

ALT H-4 visas issued at US consulates in India, all nationalities. Mar 2025–Feb 2026 compared with Mar 2024–Feb 2025: Chennai, 48,103 versus 71,652, −33%; approximately 61% of latest-period issuances. Hyderabad, 30,269 versus 39,847, −24%; approximately 39% of latest-period issuances. Grey bars show the previous period; orange bars show the latest period, on one zero-based 0–80,000 scale. Data through February 2026. Source: https://checkvisaslots.com/us-visa-statistics/in/h4/ Issuance counts do not measure appointment availability or individual approval chances.

ALT CheckVisaSlots “Where visas are issued” chart for H-1B visas issued at US consulates in India, to all nationalities. March 2025–February 2026 compared with March 2024–February 2025: Chennai 61,255 versus 112,694 (down 46%), 66% of total; Hyderabad 32,193 versus 32,764 (down 1.7%), 34%; New Delhi 25 versus 87 (down 71%); Mumbai 7 versus 73 (down 90%). Orange bars show the latest 12 months, grey markers the prior 12 months. Issuance counts do not measure interview-slot availability or personal approval chances.

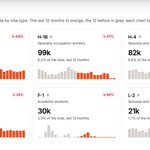
ALT CheckVisaSlots chart of US visas issued to Indian nationals worldwide. March 2025–February 2026 compared with March 2024–February 2025: B1/B2 892,982, down 4.6%; H-1B 99,496, down 37%; H-4 82,010, down 30%; C-1/D 40,458, down 24%; F-1 30,292, down 60%; L-2 20,817, down 11%. B1/B2 accounts for 74% of the total. Orange bars show the later 12 months, grey bars the earlier period; each chart has its own scale. These are issuances, not available interview slots or approval rates.


ALT Department of State warning graphic about visa fraud


