

Dr. Sajith Chanuka | Entrepreneur | Real Estate | AI | Author | Doctorate in Digital Finance | 20+ yrs Digital Transformation Leader | Writing.
Sri Lanka
Joined November 2011
- Tweets919
- Following298
- Followers95
- Likes154




Thread 1/5
NEW: Japan’s 10Y JGB yield just hit its highest level this century (~2.39% as of April 3). This isn’t just a blip. After 30+ years of ultra-low/negative rates, QE, and Yield Curve Control, Japan is finally seeing a genuine breakout in yields. Highest since 1999. Here’s the deep dive: 2/5
Why now? Oil shock from Middle East tensions (Iran conflict) is spiking imported inflation. Japan imports nearly all its energy — gasoline prices hit records before subsidies kicked in.
Markets now price ~70% odds of a near-term BoJ rate hike.
Policy normalization: BoJ exited negative rates + massive QE in 2024, hiked to 0.75% policy rate in late 2025, and is tapering bond buys. Real rates are still deeply negative, but the direction is clear.
3/5
Historical context
Japan lived in a deflationary trap for decades. 10Y yields were pinned near 0% (or even negative) via BoJ’s heavy hand. This 2.39% level shatters the post-2000 ceiling and signals the end of “financial repression.” Debt/GDP is ~250% — higher yields will bite hard on debt servicing costs (already projected to surge). 4/5
Japan implications Stronger yen potential (good for importers, bad for exporters).
Nikkei faces pressure if rates rise too fast.
Fiscal squeeze: Any tax-cut/spending plans under the current government get riskier.
But long-term positive: finally a “normal” monetary policy after the lost decades.
5/5
Global ripple effects
Japanese institutions (insurers, pensions) are huge buyers of US Treasuries/Euro bonds. Higher home yields = less capital outflow → upward pressure on global yields.
Yen carry trade (borrow cheap yen, buy higher-yield assets) faces further unwind risk. Watch the next BoJ meeting and oil prices. This could mark the start of Japan’s rate normalization era. What’s your take — bullish for JPY or risk-off for global markets? #JGB #BoJ #JapanEconomy


Short-term: The acute plunge phase looks largely done. Silver is deeply oversold, gold/silver ratio stretched, and physical deficits + explosive industrial demand (solar, EVs, AI) are strong tailwinds.
JPMorgan 2026 avg forecast still $81.More violent swings? Possible — that’s the game when leverage is extreme. But another 40-50% leg down? Low probability without fresh macro shocks.Long-term: Fundamentals favor recovery and higher prices. Paper games distort timing, not supply/demand math forever. Real solution = force full options/derivatives transparency on 13Fs and stamp out spoofing.Scrutiny > conspiracy.
If you’re in physical or PSLV and believe the story, size responsibly. NFA.What’s your view — manipulation payout or crowded-trade unwind?

🚨 SILVER CRASHED NEARLY -50% IN 53 DAYS.
And we may have found who caused it.
Silver hit ATH $121.64 on January 29, 2026. Today it sits at $65, a 46% collapse, and 25% of that drop happened AFTER February 25, 2026.
Why does that date matter?
Meet Jane Street. They made $20.5 billion in revenue in 2024 with only 3,000 employees, more than Citibank and Bank of America who both have 200,000+ employees. They do not bet on markets going up or down. They bet on markets MOVING. 87% of their $662 billion portfolio is in options, which make money when prices swing hard and fast.
In Q4 2025, Jane Street bought 20.67 million shares of SLV, the most liquid silver ETF in the world, up from just 41,100 shares the quarter before. That is a 500x increase while silver was rallying hard, and nobody knew.
- January 29: Silver hits $121.64 ATH with everyone maximally long.
- January 30: Silver collapses 30% in 30 hours, the worst precious metals crash since 1980, with CME raising margin requirements mid crash and cascading liquidations making it worse.
- February 25: Jane Street's 13F filing becomes public and the world finds out they were the LARGEST holder of SLV the entire time, bigger than BlackRock and Morgan Stanley. Silver is now dowm another 25% after this disclosure.
So Jane Street built a $1.3B secret position while silver rallied, silver crashed 30% in 30 hours, the world found out they were the biggest holder only AFTER the crash, and silver dropped another 25% on top.
49% down total, sitting at $69 today.
Here is what most people are missing.
A 13F filing only shows long equity positions and does NOT show short positions, derivatives or the full options book, meaning Jane Street could have had a massive short bet on silver through options and nobody would know.
Step 1: buy $1.3B of SLV and become the largest holder.
Step 2: build a 10x larger options position betting on silver falling.
Step 3: use that size to push the price down, ETF loses a little and options make 10x back.
Step 4: nobody finds out until 45 days after quarter end when the crash is already done.
This is not just a theory. There is documented proof Jane Street ran this EXACT playbook in India between 2023 and 2025. SEBI wrote a 105-page order, the largest fine in their history, and impounded $570 million from Jane Street.
On Bank Nifty expiry days, Jane Street bought massive amounts of index stocks in the morning to push prices up while simultaneously building short options positions 7.3 times larger than their stock position.
Then in the afternoon they sold everything, the index dropped and their puts printed money. On a single day they lost $7.5M on stocks and made $89M on options.
The stock trade was just the cost of running the operation. SEBI found this across 18 expiry days and a whistleblower said it happened on 90 to 95% of all trading days.
In crypto, the bankruptcy administrator of Terraform Labs filed an 83 page federal lawsuit against Jane Street alleging they used inside information to front-run the $40 billion Terra/LUNA collapse.
When Terraform quietly withdrew $150 million from Curve Finance with zero public notice, a wallet linked to Jane Street pulled $85 million from the same pool within 10 minutes.
A Jane Street employee had interned at Terraform and allegedly ran a private chat called "Bryce's Secret" with insiders as a back channel for non-public information, and Jane Street allegedly avoided $200M+ in losses.
Blockchain forensics traced the wallet back to Jane Street through Coinbase records. Same pattern as India: get positioned ahead of the move, extract the profit, everyone else takes the loss.
The physical silver backing SLV is held by JPMorgan, who paid $920 million in 2020 for manipulating precious metals markets, the largest CFTC sanction ever, after admitting their traders placed hundreds of thousands of fake orders in gold and silver futures for 8 straight years with their top spoofer receiving 2 years in prison.
So the full picture: the silver backing the ETF is held by a bank convicted of 8 years of silver manipulation, and the largest holder of that ETF is a firm documented running a cash into derivatives manipulation scheme in India and facing a federal lawsuit for insider front running in crypto. Silver is down 46% and sitting at $65 today.
None of this is proven in a US court and the macro explanations for the crash are real.
But no regulator has asked the one question that matters: what was Jane Street's TOTAL net silver position on January 29 and 30, including the full options book and complete derivatives exposure?
Because if the India playbook was running in silver, the $1.3B ETF stake was just the cost.
The options position on the other side was the profit. And the 49% crash was not a crash. It was a payout.

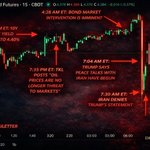
🚨🚨 BREAKING: TRUMP JUST INTERVENED — AND THE BOND MARKET FORCED IT 🚨🚨
Exactly 12 HOURS after analyst warning… it happened.
This is NOT about oil.
This is NOT about geopolitics.
This is about ONE thing:
👉 THE US BOND MARKET IS BREAKING.
Here’s what just unfolded 👇
Yesterday (7:35 PM ET):
Analyst warned that oil is no longer the biggest threat to markets.
⚠️ Analyst said: BOND MARKETS will dictate how long Trump can sustain pressure in the Iran war.
Then at 4:30 AM ET:
Some Analyst doubled down.
💥 The bond market is now MORE broken than the energy market.
And then everything changed.
📉 The 10Y yield surged to 4.45% last night.
That’s the danger zone.
That’s where things START to break.
And Trump KNOWS it.
Because we’ve seen this before 👇
➡️ April 9th, 2025:
Yields spiked → Trump paused tariffs for 90 DAYS.
Bond market pressure = policy reversal.
And now?
History just repeated.
⏱️ Within HOURS of the 10Y pushing 4.45%:
🚨 Trump POSTPONES strikes on Iranian power plants (5 days)
🚨 Claims “productive” talks with Iran
🚨 Signals de-escalation
This was NOT coincidence.
This was FORCED.
💣 The bond market just dictated US foreign policy.
But it gets even crazier…
30 minutes later:
Iran REJECTS Trump’s claims.
They say:
👉 The US is trying to “BUY TIME”
👉 This is about calming MARKETS — not peace
Let that sink in.
🌍 Global geopolitics is now being driven by bond market stress.
And the market reaction?
📉 10Y yield briefly COLLAPSES
📈 Then rebounds to 4.38%
That’s not stability.
That’s CONTROL.
That’s intervention.
And here’s the bottom line:
⚠️ The US CANNOT afford 4.50%+ on the 10Y.
At those levels:
— Debt servicing explodes
— Liquidity cracks
— Something SYSTEMIC breaks
So what are we seeing?
👉 Soft intervention
👉 Narrative management
👉 Temporary de-escalation
All to do ONE thing:
🛑 STOP THE BOND MARKET FROM BREAKING.
This is your signal.
Not oil.
Not headlines.
Not politics.
👉 WATCH THE BOND MARKET.
Because right now?
The bond market is in control.
And if yields push higher again…
Everything changes.
🚨 Stay alert. This is escalating.
🤖 Made with AI

🚨 BREAKING: US LABOR MARKET JUST FLASHED A WARNING SIGNAL 🚨
Job postings on Indeed just fell -5% YoY (week ending March 13) — now at the LOWEST level since Oct 2025.
But zoom out… it gets worse:
• Postings are down -36% since April 2022
• Now back to February 2021 levels
• Only +3% above pre-pandemic (Feb 2020)
And that’s not all 👇
LinkUp data (tracking 10,000 largest US employers) shows:
→ Job openings at the 2nd LOWEST level since 2021
This is NOT noise. This is TREND.
💡 Translation:
Labor demand is cooling FAST — and it’s spreading across sectors.
For months, the labor market was the LAST pillar holding up the economy.
Now that pillar is starting to crack.
⚠️ If job demand continues to fall:
→ Hiring slows
→ Wage growth weakens
→ Consumer spending follows
→ Recession risk rises
Markets are NOT priced for a rapid labor downturn.
This is how macro shifts begin — quietly… then all at once.
Are we watching the early stages of a labor market rollover? 👀
Drop your view below — is this a soft landing… or something bigger?
🤖 Made with AI

⚡ Breaking: Sri Lanka’s Electricity Bill Is About to Be Repriced — And It Starts with Oil at $100. Estimated tariff/Unit (cost-reflective): LKR 50 – 60 per unit
Sri Lanka’s power system looks stable on the surface, but it is quietly being priced on a variable that no one is fully accounting for — oil.
Here’s what the numbers are already telling us:
⚡ Electricity demand: 17–18 TWh today → 22+ TWh by 2030
⚡ oil produces 15-20% total supply and coal 30-33%
⚡ Oil-based generation cost today: LKR 70–90 per unit
⚡ At $100 crude: LKR 90–110 per unit
⚡ Cost gap (renewables vs oil): LKR 50–80 per unit
⚡ Just 3 TWh of oil replacement = LKR 150–240 BILLION annually
⚡ Estimated tariff (cost-reflective): LKR 50 – 60 per unit
Oil at $100 → Generation Cost Impact
At $100 crude:
Oil-based generation ≈ LKR 90–110 per kWh
Oil share ≈ 15%–20% of generation
Coal ≈ LKR 25–30
Hydro/renewables ≈ LKR 10–25
Weighted Generation Cost Estimate
If we take a realistic mix:
Hydro + RE (50%) → LKR 15
Coal (30%)→ LKR 28
Oil (20%)→ LKR 100
Weighted:
Generation cost ≈ LKR 32–38 per unit
Add System Costs (PUCSL Structure)
From tariff filings:
Transmission + Distribution + Capacity + Finance≈ LKR 15–20 per unit
⚡ Estimated tariff (cost-reflective): LKR 50 – 60 per unit
Sri Lanka does not price electricity on averages, it prices it at the margin.
And right now, the margin is still oil, what looks like a stable electricity system today is simply delayed pricing.
The adjustment comes later — through tariffs, debt, or the currency.
I’ve broken down the full mechanism, cost structure, and what this means for Sri Lanka’s economy if oil moves higher.
👉 Read the full article here: xitter.cf/chanuka4/status/203633…
Most will notice this when tariffs move.
A few will understand it before.
🤖 Made with AI


🚨 BREAKING: GOLD JUST OVERTAKES U.S. TREASURIES FOR THE FIRST TIME IN 30 YEARS 😱
It finally happened.
Central banks now hold MORE gold than U.S. government debt in their reserves.
First time since the mid-1990s.
The data just dropped — and it’s a seismic shift.
Especially if you’re in the United States.
Just look at this chart 👇
Confidence in the U.S. dollar is EVAPORATING globally.
Foreign governments aren’t chasing yield anymore.
They’re in full CAPITAL PROTECTION mode.
You can’t blame them.
Treasuries can be frozen, sanctioned, or inflated away overnight.
Gold? ZERO counterparty risk.
The only truly neutral reserve asset left. 🔥
But it gets worse.
U.S. debt is exploding — +$1 TRILLION every ~100 days.
Annual interest payments just smashed past $1 TRILLION.
At this pace, the Fed has no choice but to print.
The rest of the world sees the writing on the wall.
And they’re acting FAST.
YOU CAN SEE IT IN THE RESERVES:
China. Russia. India. Poland. Singapore.
Country after country dumping paper assets for hard money.
Then there’s BRICS.
This isn’t just “trade cooperation.”
It’s full-blown DE-DOLLARIZATION.
New payment rails outside SWIFT.
Energy deals in local currencies.
Reserve systems backed by GOLD & SILVER — not IOUs.
Nations representing 40%+ of the world’s population are done with the dollar.
TINA (There Is No Alternative) is officially DEAD.
Gold is the new alternative.
If you think $6,000 gold and $150 silver sounds “extreme”…
You’re not ready for what’s coming.
I’ve called every major market top and bottom for the last 15 years.
When I fully EXIT the markets, I’ll announce it here publicly — like I always do.
A lot of people are going to wish they listened sooner.
This is the macro earthquake.
Are you positioned?
Or still betting on the dying dollar?
Drop your thoughts below 👇
RT if you see the shift happening
Follow for real-time macro alerts — I don’t sugarcoat anything 💣
----------------------------------------------------------
If you want to stay ahead of new developments in finance, equities, crypto, and the geopolitical landscape, subscribe for free to get regular updates
X- xitter.cf/chanuka4
Substack - substack.com/@drsajithchanuk…

Everyone is arguing about whether the U.S. economy should slow in 2026.
But the real constraint isn’t growth.
It’s *where* growth is still coming from — and *where* it has already stopped.
I laid out the numbers and structure in this article.
What do you think breaks first? Read the article and let me know
xitter.cf/chanuka4/status/201900…

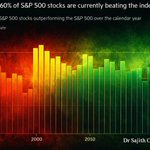
🚨 BREAKING: HISTORIC MARKET BREADTH EXPLOSION – 66% of S&P 500 Stocks CRUSHING the Index YTD! 😱📈🔥
This is the HIGHEST level since records began in 1986! (Bloomberg/Investing.com data)
Percentage has MORE THAN DOUBLED from the mega-cap concentration hell of recent years:
- 2023: Only 29% beat the index
- 2024: 29%
- 2025: 31%
Now? 66% outperforming – even STRONGER than post-Dot-Com bubble recovery in 2000-2002!
That means 332 out of 500 stocks are beating the S&P's modest +0.7% to +1.65% YTD gain (depending on exact close)!
Big twist: Of the Magnificent 7? ONLY Nvidia is outperforming the benchmark so far in 2026. The rest? Lagging HARD!
This screams THE GREAT ROTATION is REAL – from narrow tech dominance to BROAD market leadership! Cyclicals, value, industrials, financials waking up!
FOMO Alert: Bull market getting healthier + legs for bigger gains? Or just a head-fake before tech reclaims throne?
Missing this broadening could cost you MASSIVE alpha in 2026!
Your play: Rotating into broader names? Still riding Mag7? Or hedging both? 👇
RT if this is bullish AF for the bull run! 🔥
Like if you're loving the breadth!
Comment: Which sector are you loading up on now? #MarketBreadth #SP500 #GreatRotation #Investing #StockMarket #Macro

🚨 BREAKING: MASSIVE CAPITAL FLIGHT FROM US – Record $10B+ Weekly Inflows Pouring Into European Stocks! 😱🌍💰
Global investors are DUMPING Wall Street exposure and ROTATING HARD into Europe – February 2026 on track for ALL-TIME HIGHEST monthly inflows EVER! 📈 (EPFR data via FT)
Two straight weeks of ~$10B each flooding European equity funds – biggest rush in history!
Why now?
- US market "expensive" + AI bubble fears
- Diversification away from mega-tech concentration
- Surging optimism on Europe's economy (record highs in investor surveys!)
"The BIG ESCAPE has started" – investors fleeing overvalued US for undervalued Europe!
FOMO Alert: European stocks breaking out to new highs while US lags? Is this the start of a multi-year rotation? Missing this could be COSTLY!
Your take: Loading up on Euro stocks? Still all-in on US tech? Or hedging both? 👇
If you want to stay ahead of new developments in finance, equities, crypto, and the geopolitical landscape, subscribe for free to get regular updates
Substack - substack.com/@drsajithchanuk…
X- xitter.cf/chanuka4
RT if you're rotating to Europe! 🔥 Like if this is the macro shift of 2026! Drop your portfolio moves below! #EuropeStocks #CapitalRotation #USExit #Investing #Macro #StockMarket

🚨 BREAKING: TRUMP DEFIES SUPREME COURT – Slaps NEW 15% GLOBAL TARIFF! Gold SURGES, Dollar CRASHES! 😱💥📈
After SCOTUS ruled his massive emergency tariffs ILLEGAL (6-3 landmark decision Friday), Trump FIRES BACK: Raises global import tariff from 10% → 15% effective IMMEDIATELY under new authority! 🌍🔥
Markets reacting HARD:
- Gold jumps to 3-week highs (safe-haven rush!)
- US Dollar slides as "Sell America" trade revives
- Uncertainty exploding over global trade wars 2.0
This is MACRO CHAOS: Trade deals in doubt, inflation risks spiking, recession fears back on the table!
FOMO Alert: Gold breaking out? Dollar diving deeper? Is this the start of the next big safe-haven run?
Your move: Loading up on gold? Hedging tariffs? Or betting on Trump winning the trade war? 👇
RT if this is recession incoming! 🔥 Like if you're watching gold closely! Comment your trade! #TrumpTariffs #GoldRush #DollarCrash #TradeWar #Macro #Economy

🚨 BREAKING: TRUMP DEFIES SUPREME COURT – Slaps NEW 15% GLOBAL TARIFF! Gold SURGES, Dollar CRASHES! 😱💥📈
After SCOTUS ruled his massive emergency tariffs ILLEGAL (6-3 landmark decision Friday), Trump FIRES BACK: Raises global import tariff from 10% → 15% effective IMMEDIATELY under new authority! 🌍🔥
Markets reacting HARD:
- Gold jumps to 3-week highs (safe-haven rush!)
- US Dollar slides as "Sell America" trade revives
- Uncertainty exploding over global trade wars 2.0
This is MACRO CHAOS: Trade deals in doubt, inflation risks spiking, recession fears back on the table!
FOMO Alert: Gold breaking out? Dollar diving deeper? Is this the start of the next big safe-haven run?
Your move: Loading up on gold? Hedging tariffs? Or betting on Trump winning the trade war? 👇
----------------------------------------------------------
If you want to stay ahead of new developments in finance, equities, crypto, and the geopolitical landscape, subscribe for free to get regular updates
Substack - substack.com/@drsajithchanuk…
X- xitter.cf/chanuka4
RT if this is recession incoming! 🔥 Like if you're watching gold closely! Comment your trade! #TrumpTariffs #GoldRush #DollarCrash #TradeWar #Macro #Economy

🚨 BREAKING: US FREIGHT RECESSION ACCELERATING – Cass Index CRASHES to 2009 GFC Levels! 😱📉
Cass Freight Index shipments PLUMMETED -7.1% YoY in January to 0.886 – LOWEST since April 2009! (Cass Information Systems)
36 CONSECUTIVE monthly declines – LONGEST streak EVER recorded!
Shipments DOWN -20.9% over the period – mirroring the 2008 Financial Crisis collapse!
Normal seasonality? February could see ANOTHER -11% YoY drop... unless weather rebound saves it.
This is a LEADING indicator of US economic momentum – and it's SCREAMING slowdown!
FOMO: Is the freight recession signaling broader recession ahead? Economy flashing RED!
What do you think – Recession incoming or soft landing still possible? 👇
If you want to stay ahead of new developments in finance, equities, crypto, and the geopolitical landscape, subscribe for free to get regular updates
Substack - substack.com/@drsajithchanuk…
X- xitter.cf/chanuka4
RT if you're concerned! Like if you're watching this closely! #FreightRecession #CassIndex #Economy #RecessionWatch #Macro
