
Technologist, 30+ years in fin markets. Always trying to learn. Not financial advice. Focused on simplicity and the bigger picture. Love disruptive Technology
Joined April 2022
- Tweets5.6K
- Following558
- Followers4.2K
- Likes2.5K


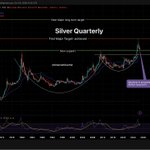


#silver forecast back in April.
I think we wick down to $50ish but that level gets bought fast.
Let’s see how this plays out.


Every single person that sells a subscription is the exact same. They need engagement, they need you to need them. Fear porn does just that.
Gold and silver are in a large and HEALTHY consolidation, yes. But the story is not over. Far from it.
Peter wants clicks and subs.
#gold #silver

Not predicting it, but what it it happens $GC_F
The entire 2025 advance gets erased
How about that Mr. @PeterSchiff
That would not be according to your script

#GOLD $SPX
This chart shows how many S&P 500 "units" one ounce of gold buys, plotted monthly back to 1957 on a log scale.
When the line rises, gold is outperforming stocks.
When it falls, stocks are winning.
The current reading is 0.544, so an ounce of gold is worth about 54% of one S&P 500 index point.
The big picture: long regime swings
The ratio moves in multi-decade waves that line up with economic regimes:
•1970s to 1980: Gold crushed stocks. Inflation, the end of the gold standard and oil shocks pushed the ratio to about 7.
•1980 to 2000: Stocks dominated for 20 years while disinflation and falling rates fed the equity boom. The ratio bottomed near 0.17 at the dot-com peak.
•2000 to 2011: Gold outperformed again (two bear markets, the financial crisis, QE). The ratio peaked around 1.6.
•2011 to about 2022: Stocks won again as low rates and big tech rallied, and the ratio fell to roughly 0.37–0.40.
Each of these trends lasted 10–20 years, which is the main lesson. Once a regime turns, it tends to persist.
What the recent action suggests
•A long base formed from about 2015 to 2024. The ratio stopped making meaningful new lows, which is what the chartist's orange "rounded bottom" is highlighting.
•The 2025 spike to about 0.80 was gold's sharpest relative surge in over a decade. Monthly RSI hit about 80, which is overbought.
•Since then it has pulled back to 0.544 and is sitting right on the rising 36-month moving average (0.527). This is the key detail. The 3-year trend line is turning up for the first time since the early 2010s, and price is testing it as support.
•RSI at 48, below its own average of 60, means the momentum from 2025 has cooled to neutral. It isn't bearish, but it isn't confirming a new leg up yet.

Once again @SouthwestAir doing everything they can to screw their regular business travelers.
It’s all about the credit card spend now. Harder and harder to get status from travel alone.

Still on track #gold

#silver weekly chart.
Pretty clear here
Nothing exciting until about the moving average line with confirmation.
If we hit $50ish, I’d be going ridiculously long

The Bottom of the Grand Canyon is Extremely Strange youtu.be/-0FI1TLwXfk?is=qLkY… via @YouTube
Absolutely unreal video.


Told you #uranium

Google parent Alphabet is close to an agreement to buy nuclear energy from Constellation Energy, as technology companies race to line up power for the data-center boom. bloomberg.com/news/articles/…

