

Crime news and reported crime stats from Denver's Capitol Hill neighborhood.
- Tweets730
- Following302
- Followers447
- Likes147


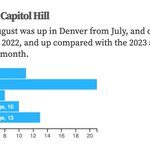




ALT Burglary in August was up in Denver from July, and down compared against August 2022, and up compared with the 2023 average of 10 burglaries per month.


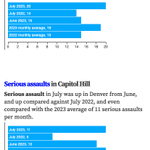
ALT Violent crime in July was up in Denver from June, and up compared against July 2022, and up compared with the 2023 average of 19 violent crimes per month. Serious assault in July was up in Denver from June, and up compared against July 2022, and even compared with the 2023 average of 11 serious assaults per month.

ALT A map showing notable crimes reported in Capitol Hill in July.


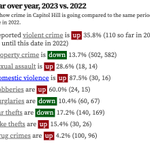
ALT Year over year, 2023 vs. 2022 See how crime in Capitol Hill is going compared to the same period of time in 2022. Reported violent crime is up 35.8% (110 so far in 2023, 81 until this date in 2022) Property crime is down 13.7% (502, 582) Sexual assault is up 28.6% (18, 14) Domestic violence is up 87.5% (30, 16) Robberies are up 60.0% (24, 15) Burglaries are down 10.4% (60, 67) Car thefts are down 17.2% (140, 169) Bike thefts are up 15.4% (30, 26) Drug crimes are up 4.2% (100, 96)


ALT Reported violent crime is up 30.1% (95 so far in 2023, 73 until this date in 2022) Property crime is down 12.1% (420, 478) Sexual assault is up 30.8% (17, 13) Domestic violence is up 53.3% (23, 15) Robberies are up 75.0% (21, 12) Burglaries are down 24.2% (47, 62) Car thefts are down 15.1% (118, 139) Bike thefts are down 4.0% (24, 25) Drug crimes are down 1.4% (70, 71)


ALT A bar chart showing monthly reported motor vehicle thefts in Denver. In 2019 about 400 cars per month were stolen, in recent months that figure is around 1,200.

ALT Two bar charts, one showing property crimes downtown by day of the week (Tuesday-Friday has the most) and the other showing violent crimes by day of the week (starts low on Monday, ramps up to a high on Saturday).

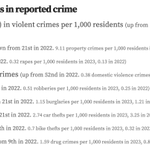
ALT So far this year, Capitol Hill ranks in reported crime 8th (out of Denver's 78 neighborhoods) in violent crimes per 1,000 residents (up from 19th last year. 2.17 violent crimes per 1,000 residents this year, 1.34 up until this point last year) 24th in per-capita property crimes (down from 21st in 2022. 9.11 property crimes per 1,000 residents in 2023, 10.06 in 2022) 8th in per-capita rapes (up from 18th in 2022. 0.32 rapes per 1,000 residents in 2023, 0.13 in 2022) 29th in per-capita domestic violence crimes (up from 52nd in 2022. 0.38 domestic violence crimes per 1,000 residents in 2023, 0.13 in 2022) 9th in per-capita robberies (up from 39th in 2022. 0.51 robberies per 1,000 residents in 2023, 0.25 in 2022) 29th in per-capita burglaries (down from 21st in 2022. 1.15 burglaries per 1,000 residents in 2023, 1.21 in 2022) 28th in per-capita car thefts (down from 21st in 2022. 2.74 car thefts per 1,000 residents in 2023, 3.25 in 2022) 2nd in per-capita bike thefts (up from 15th in 2022.


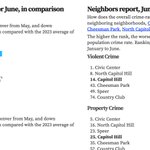
ALT A screenshot of the map at https://crime.denverpost.com/map/trends/#burglary This text is on the screenshot: Mapping the monthly trends in Denver’s reported burglary crimes. In the city of Denver, 514 of these crimes were reported in the previous 30 days, compared with 406 the 30 days before that. Of these crimes, Civic Center (6.78 per 1,000 residents) had the highest population-adjusted rate of crimes and Central Park (28) had the highest total count in the time period.