

Run by @JDPipping and @AdiWyner. A @WhartonSABI project.
- Tweets16
- Following7
- Followers13
- Likes0




ALT A line chart shows New Orleans Pelicans win probability throughout the game against Denver Nuggets on Oct. 24, 2026. Final score: Denver Nuggets 141, New Orleans Pelicans 135. The highlighted peak is 98.7%, up 110–91 with 11:09 remaining in Q4. The first reported win probability was 21.1%. Source: ESPN.

ALT A line chart shows Chicago Bulls win probability throughout the game against Washington Wizards on Oct. 24, 2026. Final score: Washington Wizards 124, Chicago Bulls 120. The highlighted peak is 80.1%, up 60–50 with 1:37 remaining in Q2. The first reported win probability was 45.4%. Source: ESPN.

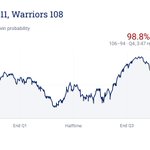
ALT A line chart shows Golden State Warriors win probability throughout the game against Memphis Grizzlies on Oct. 23, 2026. Final score: Memphis Grizzlies 111, Golden State Warriors 108. The highlighted peak is 98.8%, up 106–94 with 3:47 remaining in Q4. The first reported win probability was 58.5%. Source: ESPN.

ALT A line chart shows Milwaukee Bucks win probability throughout the game against Chicago Bulls on Oct. 23, 2026. Final score: Chicago Bulls 132, Milwaukee Bucks 125. The highlighted peak is 90.5%, up 26–11 with 3:18 remaining in Q1. The first reported win probability was 56.1%. Source: ESPN.

ALT A line chart shows Cleveland Cavaliers win probability throughout the game against Philadelphia 76ers on Oct. 22, 2026. Final score: Philadelphia 76ers 114, Cleveland Cavaliers 106. The highlighted peak is 99.0%, up 69–40 with 0:52.6 remaining in Q2. The first reported win probability was 29.2%. Source: ESPN.

ALT A line chart shows New Orleans Pelicans win probability throughout the game against Indiana Pacers on Oct. 21, 2026. Final score: Indiana Pacers 123, New Orleans Pelicans 120. The highlighted peak is 87.7%, up 95–88 with 10:03 remaining in Q4. The first reported win probability was 38.0%. Source: ESPN.

ALT A line chart shows New York Knicks win probability throughout the game against Philadelphia 76ers on Oct. 20, 2026. Final score: Philadelphia 76ers 106, New York Knicks 100. The highlighted peak is 80.8%, up 46–37 with 5:31 remaining in Q2. The first reported win probability was 52.1%. Source: ESPN.

ALT A line chart shows Boston Celtics win probability throughout the game against Detroit Pistons on Oct. 20, 2026. Final score: Detroit Pistons 121, Boston Celtics 113. The highlighted peak is 98.5%, up 72–50 with 8:19 remaining in Q3. The first reported win probability was 48.9%. Source: ESPN.

ALT A line chart shows Los Angeles Rams win probability throughout the game against Arizona Cardinals on Oct. 18, 2026. Final score: Arizona Cardinals 18, Los Angeles Rams 16. The highlighted peak is 91.5%, tied 0–0 with 12:18 remaining in Q1. The first reported win probability was 87.3%. Source: ESPN.

ALT A line chart shows Indianapolis Colts win probability throughout the game against Tennessee Titans on Oct. 18, 2026. Final score: Tennessee Titans 26, Indianapolis Colts 20. The highlighted peak is 94.1%, up 13–0 with 15:00 remaining in Q3. The first reported win probability was 72.3%. Source: ESPN.

ALT A line chart shows Tampa Bay Buccaneers win probability throughout the game against Pittsburgh Steelers on Oct. 18, 2026. Final score: Pittsburgh Steelers 26, Tampa Bay Buccaneers 19. The highlighted peak is 91.0%, up 16–3 with 0:00 remaining in Q3. The first reported win probability was 41.5%. Source: ESPN.

ALT A line chart shows Baltimore Ravens win probability throughout the game against Cleveland Browns on Oct. 18, 2026. Final score: Cleveland Browns 13, Baltimore Ravens 10. The highlighted peak is 87.5%, up 10–3 with 1:45 remaining in Q3. The first reported win probability was 55.5%. Source: ESPN.

ALT A line chart shows Los Angeles Rams win probability throughout the game against Buffalo Bills on Oct. 12, 2026. Final score: Buffalo Bills 37, Los Angeles Rams 34. The highlighted peak is 83.7%, tied at 34–34 with 5:37 remaining in OT. The first reported win probability was 58.0%. Source: ESPN.

ALT A line chart shows Atlanta Falcons win probability throughout the game against Baltimore Ravens on Oct. 11, 2026. Final score: Baltimore Ravens 30, Atlanta Falcons 23. The highlighted peak is 97.6%, up 23–15 with 2:25 remaining in Q4. The first reported win probability was 60.1%. Source: ESPN.

ALT Jaguars 19, Eagles 17, October 11, 2026. A line chart shows Philadelphia's ESPN win probability over the full game, using every timed feed observation. The vertical axis runs from 0% to 100%, with a 50% midpoint; the horizontal axis marks kickoff, the end of the first quarter, halftime, the end of the third quarter, and the final whistle. The entire path is navy, with a red dot at the 99.9% maximum, when Philadelphia led 17–16 with eight seconds remaining in Q4. The observed final probability is zero. The first, untimed feed observation is retained in the source data but excluded from the time plot.