

#Bitcoin (not financial advice) (no DM's)
Joined December 2010
- Tweets12.7K
- Following804
- Followers20.1K
- Likes14K


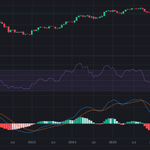


Update on the 20D Bitcoin chart with RSI and MACD, eight months later. Looks amazing, especially the MACD perspective. Yes, there was another 'crash' in May/June, but starting DCA'ing BTC when dark red flipped to light red in February was a smart strategy.
xitter.cf/bitharington/status/20…


Finally, a higher high for Bitcoin. That's essentially the last argument of the bears. Bitcoin is punishing those who refused to stack below the previous ATH (~70K). No Daily/Weekly close of this higher high confirmed yet, but this feels like a classic Bitcoin bull market.
February was the Bitcoin bottom. June was a fake out. This happens all the time. Same pattern:
xitter.cf/bitharington/status/16…

Bitcoin holding pretty strong while various indicators (RSI, MACD, Fisher) cool down, is exactly what we need for the next Bitcoin pump. But some dull price action and another boring dip first, I guess. Patience. Don't let them buy your Bitcoin. (Chart = 12H chart)

This is real. Indicators like the RSI tell a story. Selling Bitcoin below the previous ATH ($70K) was not wise - it was clearly stupid. The months long Bitcoin accumulation period appears to be over. Be bullish.
xitter.cf/bitharington/status/20…


$60K in February was the Bitcoin bottom. Basically six months of bottom zone and accumulation. Nothing beats normie sentiment. It's still the best indicator.
xitter.cf/bitharington/status/20…
The Bitcoin bottom is not a precise price or date. It's a price zone. The bottom this time, is the area below previous ATH; sub ~$70K. We're above this price zone now. One day we will leave this price zone forever. Lots of traders/gamblers will buy higher.
xitter.cf/bitharington/status/20…
People sell Bitcoin below the previous ATH of ~70K... Imagine selling below the ATH of the cycle before; that's selling around ~20K in 2022. That's the same. It's stupid. BTC can go lower; no one can predict the future. But it doesn't make sense to sell below ~$70K...

I still believe in this perspective; although it's not that easy to spot on the BTC/USD chart. February $60K was the bottom. Who cares if we go somewhat lower. It's not about the details; zoom out. We're already six months in the boring waiting phase now.
xitter.cf/bitharington/status/20…


Source: colintalkscrypto.com/cbbi/in…

Diminishing returns are very real, but buying Bitcoin at 50% discount of the previous ATH is still fun.

It's still the same imo. Do not sell Bitcoin below previous ATH; Do not sell Bitcoin below ~$70000. In fact; I just bought 0.1 Bitcoin at ~$63500.
xitter.cf/bitharington/status/20…
People sell Bitcoin below the previous ATH of ~70K... Imagine selling below the ATH of the cycle before; that's selling around ~20K in 2022. That's the same. It's stupid. BTC can go lower; no one can predict the future. But it doesn't make sense to sell below ~$70K...
Update Bitcoin chart (20D). Positive imo. The MACD looks great - looks like a trend reversal. And the RSI has a lot of room to go up.
xitter.cf/bitharington/status/20…

So, 5 Feb / 6 Feb was actually the Bitcoin bottom? It seems... Crazy. It's always the same pattern. You couldn't make this up... Normie sentiment is the best indicator, lol.
xitter.cf/bitharington/status/20…