

Beautiful visualizations of challenging Bitcoin metrics, with raw data available in CSV/XLSX/JSON formats. Updated hourly. https://xitter.cf/t.co/nPBbDtODaP
Joined March 2023
- Tweets538
- Following679
- Followers887
- Likes2.4K





Bitcoin Is Data retweeted
looking for long-term sponsors
the incredible folks @OpenSats have been funding BRK but they can't do it forever
if you're interested or rely on my work, please reach out
I would much rather keep working fully public and share everything than split my focus with a paid product
Bitcoin Is Data retweeted

Bitcoin Core broke Bitcoin, at least in the trust we used to have in its neutra and uncorruptible protocol. They are the single point of failure we thought Bitcoin didn't have.


Bitcoin Is Data retweeted
Gold vs Bitcoin- Bitcoiners, the market is sending us a warning: it wants/needs sound money. If our money can be tinkered with without a valid reason, even if it has superior monetary properties, it's not hard money. So let's get our shit together & start by getting rid of Core.

Bitcoin Is Data retweeted
Excelente.
Na minha opinião faltou apenas dizer que em 2025 descobrimos que os cabeças da principal implementação de bitcoin praticamente não possuem bitcoin, não entendem dos aspectos econômicos do BTC e estão sujeitos a fazerem mudanças no protocolo caso sejam pagos para isso.
Bitcoin Is Data retweeted
Last fall at about USD 85k we saw huge demand.
Around 5% of all dollars ever invested in bitcoin entered at that level.
About 70% of all invested dollars sit above it.
If price drops below USD 85k it could become a major stress point.

Bitcoin Is Data retweeted
Luis, o bitcoin está muito mais fraco do que qualquer outro ativo, infelizmente.
Tem alguma coisa errada/quebrada aí que ainda não sabemos.
Do jeito que está, se a bolsa americana tiver um soluço mais forte, o BTC vai de novo corrigir uns 80% do topo, como das últimas vezes.
Bitcoin Is Data retweeted
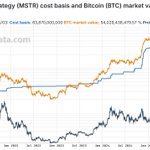
Our MSTR page is now back online with updated data.
Not a good picture for Saylor's Strategy, as its mNAV fell below one, which means the company’s total stock value is now lower than its bitcoin holdings.

Bitcoin Is Data retweeted
Global M2 calculation is screwed since China hasn’t published any new monetary aggregate data since May 2025.


Bitcoin Is Data retweeted
What about all the global M2 charts now that China’s central bank hasn’t released any data since May 2025?


Bitcoin Is Data retweeted

DAILY INDEX – LIVE THREAD
Track the biggest Bitcoin moves from exchange flows and ETF activity to major on-chain transfers.
Find out who’s moving Bitcoin today and what it means for the market.
Today's highlight: An anonymous entity continues accumulating Bitcoin from Kraken.
🧵
Bitcoin Is Data retweeted
China's central bank hasn’t updated its money supply data for several months.
Normally, they release the previous month’s figures in the last days of the following month, but the most recent data available is from May 2025.
Did something go wrong?

Bitcoin Is Data retweeted
The total balance held in all SegWit addresses (P2WPKH) has finally surpassed that of legacy addresses (P2PKH), and they are now the dominant address class.

Bitcoin Is Data retweeted
Yes, it's custom code developed over the years.
Some calculations are very computationally expensive, so I had to develop highly efficient routines.
Today, I can have all metrics updated at one-hour intervals.
All raw data is available on our website. If you need something, just ask, and I’ll see if it’s possible to provide it.
Bitcoin Is Data retweeted
How to Know if We Are Close to a Bitcoin Price Cycle Peak?
Here we are, with Bitcoin breaking one all-time high after another. Everything looks fantastic, and it seems this honeymoon will never come to an end.
“This time is different! It’s a supercycle!”
I’ve heard that before…
For those who have been around for a long time, we know that at some point over the next 6 to 12 months, things tend to go south. But before that, and based on prior cycle, we should see an euphoria phase, with Bitcoin’s price rising significantly. Exciting times ahead!
So how do we know when the price might be near its peak? Nobody has a crystal ball to see the future, but we can use some on-chain indicators to guide our decisions. One of them is the MVRV (Market Value to Realized Value) ratio.
MVRV divides Bitcoin’s market capitalization (the current value in USD of all bitcoins in circulation) by its realized capitalization (all the USD that entered the Bitcoin network at the time of purchase). You can think of it as how many times, on average, BTC holders are “in profit.” For example, an MVRV of 2 means the average holder has doubled their value in USD terms, i.e., a 100% fiat gain.
We’ve revamped our MVRV chart to make it more visually appealing and added a one-year moving average (the red-dotted line), usually called the “MVRV Momentum.” That’s because, in bull markets, the MVRV tends to bounce off this line. As of now, the average holder is up 2.18x on their original cost basis, in USD terms, as shown in the chart below.
You can also view the MVRV ratio for specific holder cohorts, either short-term holders (STH) or long-term holders (LTH), from 1 month to up to 4 years. For example, below we show the MVRV ratio for STH, who have held Bitcoin for less than 5 months. They are almost at the waterline, with an MVRV of just 1.05.
A new addition to our suite of charts is the MVRV Rolling Window Z-Score, in which we standardize (subtract the mean and divide by the standard error) of the MVRV series, so that the resulting series have a mean of zero and a standard deviation of one.
We also calculate a rolling MVRV over a two-year (720-day) window, so that ancient history doesn’t skew current values. You can change this time window to any number of days using the input box provided.
The interpretation of this metric changes slightly: when it’s zero, MVRV is exactly at its historical mean. A Z-score of 2, for example, means the current MVRV is two standard deviations above the mean.
So, how can we use these metrics to identify a potential cycle peak? If we analyze MVRV peaks from previous cycles, we find that in 2017 the MVRV topped at 5.3, and in 2021 it reached 4.01. With the current MVRV sitting at 2.36, there still seems to be room for further upside before things get too hot.
We’ll continue monitoring the situation, but for now, the most likely scenario is that Bitcoin’s price keeps climbing.
That’s all for today, have a great one!


