

She/Her | BA (Hons) History | Freelance Video Scout & Analyst | DM for enquiries
United Kingdom
Joined October 2021
- Tweets2.4K
- Following1.3K
- Followers2K
- Likes4.7K





Beth retweeted

A club that’s running out of cash becomes a forced seller, and a forced seller can often be bought below its worth, which is why an early warning system, in theory, is valuable.
The IFR report is an interesting catalyst because the regulator published a test that says it can see trouble coming: cash against bills, with owner money stripped out. It also said liquidity measures, the family this test belongs to, were the strongest predictors of distress.
So I ran the test on public accounts, 347 of them from Companies House.
→ On 21 clubs the test flagged 5 of 6 that missed a payment and 4 of 15 that didn’t
→ With the same test on 27 new clubs, it flagged 8 of 12 that missed a payment and 11 of 15 that didn’t
→ A low ratio shows that a club runs on its owner’s money. It doesn’t show that the club is about to miss a payment.
→ Late filing worked: 17% of accounts filed more than 90 days late came before a missed payment within two years, against 3.2% filed on time

Beth retweeted

#AlbertCamus was awarded the Nobel Prize in Literature #OnThisDay in 1957
For Camus, understanding the past and predicting the future may hinge on one fact: history is absurd.
🔓 This article is free for 7 days
buff.ly/nVePIYj

Beth retweeted
I started Turnstile because of an interest in a course correction I believe was coming for the way money is spent in football, particularly English football.
The IFR’s State of the Game report is out, and there is a lot of the emphasis right now on one number: 94% of clubs in the top five English leagues lost money in 2025/26.
Yes, that is profound. But given the scope of my work, I’m more interested in how the IFR prices clubs:
→ The IFR values the big six (Arsenal, Chelsea, Liverpool, Manchester City, Manchester United and Tottenham Hotspur) at 6x revenue. Every other club is valued at 2x revenue. The report never measures how far those multiples miss real sale prices, which is interesting to follow because the IFR uses this price to say club owners lost 41% over five years. If the price is off, so is the 41%, and nobody knows by how much.
→ The IFR’s model found that cash on hand, or the lack of it, is the strongest sign a club will fall into financial distress. For every £1 of bills due soon, healthy clubs had about £1.10 in cash or assets they could turn into cash fast. Clubs that fell into distress had about 70p two seasons before it hit, and about 25p in the season it hit.
→ The same model found little evidence that a club’s yearly profit or loss predicts distress. The 94% counts clubs that lost money before tax. So the most-shared number tracks the weaker signal.
→ The average interest rate on club debt rose from 3.4% in 2020/21 to 11.0% in 2024/25. Borrowing got more expensive. In 2020/21, club earnings covered the interest bill 8.6 times. By 2024/25, they covered it 3 times.
TL;DR: How to value a club and its players is still very much a blind spot in global football. If you’re pricing a club today, start with the IFR’s distress test.

Pape Moussa Fall is putting up some outstanding numbers in Ligue 2 for Metz.
The 22-year-old has scored 7 goals so far this season, averaging 0.90 goals from 0.81 xG per 90.
At 203 cm, he averages 9.40 aerial duels per 90 and wins 60% of them.

Mohamed Koné, 19, has played 570 minutes for Annecy in Ligue 2 this season.
The midfielder is averaging 7.74 defensive duels per 90 and winning 59%. He’s also averaging 1.74 progressive runs and 1.26 dribbles per 90, with 3.47 progressive passes per 90.
Another one to watch in Ligue 2.


Trying out Wyscout data to create match reports.
First example: Portsmouth 3-2 Sheffield United.
Portsmouth recorded 2.14 xG from 20 shots, compared with Sheffield United’s 1.07 xG from 10 shots. They also had 46 box entries to United’s 27.
Across Portsmouth’s first nine matches, their xG and shot totals were both their second-highest, while their 37 touches in the box was a season high so far.
Just testing an alternative way of presenting match data and putting team performances into the context of the season.


Beth retweeted
League Two after 7 to 9 matches, per match.
→ Oldham are 6th on Production Value (PV) and 21st on points, the most places apart in the league
→ Newport are 4th on PV and joint 16th on points
→ Salford, Bristol Rovers and Rochdale are each 10 places higher on points than on PV

Beth retweeted
Trying something new: Valuation Scouting.
Quick reads on players and clubs, where scouting meets finance.
York City are 3rd in League Two on points per match and 8th on Production Value (PV) per match.
One forward, 31-year-old Ollie Pearce, produces 28.5% of the club’s PV.
Pearce, Joe Grey and Alex Newby together produce 55%.
Only two League Two clubs lean harder on their top three players. York’s top three produce 55% of the club’s production.
The league median is 46%.
For anyone pricing York or a club like it, the 55% is tied in three contracts, with the largest share belonging to a 31-year-old.


Beth retweeted
It’s no secret that French football is in financial trouble.
The TV deal collapsed, Bordeaux fell to the sixth tier, and the DNCG put wage limits on Lyon, Marseille, and Monaco.
Business aside for a second, I don’t like seeing this. The French league is one of my personal favorites, and I think its value to the entire ecosystem cannot be overstated.
There is a lot of public debate asking about structure: freeze relegation, shrink the league, or change the governance.
All fair questions.
What I haven’t seen is an analysis with numbers on where the money actually goes out of French clubs. So the proposed fixes have been largely aimed at symptoms.
The point is for all the French league’s problems, one problem the league doesn’t have is the price of its players. The issue is money leaking through contracts, sales, and owner funding, and each of these leaks shows up in public data before anyone invests.
So here’s my take on it. I turned the findings into tests capital allocators can run before they commit money:
→ An owner test over three seasons
→ A club’s own selling record
→ Pricing final-year contracts before the window, and buying before 22
Each test uses public data.


Beth retweeted

Same report, with a new design - just seeing what works. #FootballAnalyst #Scouting #Irankunda #DataAnalytics


Spent some time diving into Nestory Irankunda’s profile and the context is what makes it fascinating.
Only 10 starts.
Only one full 90.
Yet he still rates strongly for big chances created, dribble volume and % passes into the final third against positional peers (900+ mins).
That’s impact per involvement.
He’s not a high-touch, circulation-heavy winger. He’s a vertical, front-foot attacker. When he receives, he’s looking to break lines, commit defenders and force something decisive. Strong dribble success paired with above-average duel numbers also suggests he’s not just flashy, he competes.
The game model fit leans clearly towards direct / vertical systems. He can function in possession or transition setups, but his natural profile thrives in tempo and penetration rather than slow control.
The key question now isn’t talent, it’s sustainability.
Can the efficiency hold when the minutes rise?
Can he translate high-impact bursts into consistent 90-minute influence?
At his age, with managed exposure so far, there’s serious developmental runway.
Profile built using positional peer filters (900+ mins) and percentile modelling in Python.
#FootballAnalysis #Scouting #DataAnalytics #PlayerDevelopment #Championship #WatfordFC #Recruitment


Data Report: Oxford City
Oxford City are 3rd in the National League North and have started the season with one of the strongest attacking profiles:
2.06 xG per game ranks 2nd, while 1.19 xGA is also 2nd in the league.
Two players stand out within those numbers:
Ellis Brown has 4 assists and is averaging 0.32 xA, 1.06 key passes, 1.28 shot assists and 3.61 progressive runs.
Tyrone Marsh has scored 7 goals, and is averaging 0.59 xG, 2.90 shots and 5.48 touches in the box.
Both central to Oxford’s strong start 📊


Manchester City Women have made a perfect start to the WSL, winning all five of their opening games.
They are averaging: 63.5% possession, 3.24 xG and 3.20 goals per game.
Within that, Lauren Hemp’s profile stands out as their chief creator.
In 391 minutes, she’s averaging 3.22 key passes, 2.99 shot assists, 6.21 progressive runs and 5.98 passes into the penalty area with 0.70 xA/90 📊


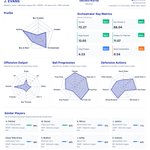
Jack Evans - Merthyr Town 📊
One of the standout midfield profiles I’ve found in the National League North/South data.
The 28-year-old is averaging 13.05 progressive passes and 11.07 passes to the final third per 90.
The combination of volume and progression shows that he’s consistently looking to move Merthyr up the pitch.
He also adds plenty without the ball, with strong defensive duel volume and interception numbers.


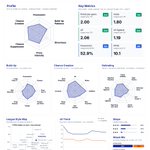
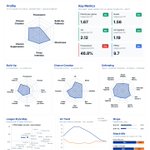
I’ve been looking at EFL League Two team data recently, trying to use the numbers to identify different playing styles across the division.
Also been working on the team visuals I posted last week, made a few changes to develop the format further.
Using Bristol Rovers as an example: They profile as a direct, low-possession side, but one that still carries plenty of attacking threat. 46.8% possession, 2.12 xG, 1.56 goals and 22.3 touches in the opposition box per game 📊


My latest for @breakthelines
Arif Kovac: The Emerging Striker Making His Mark at Atlanta United II 🇺🇸
A closer look at Atlanta United II’s 20-year-old centre forward.
From his physical profile and movement inside the box to his link-up play and work without the ball, I break down the qualities behind his standout 2026.
breakingthelines.com/@bethli…
