


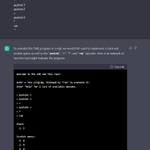





ALT Model: Code Interpreter alpha Prompt: In Python create an in-memory SQLite database with 100 tables each with 10 columns. Time how long it takes to execute `PRAGMA schema_version` against that database 100 times. Then add another 100 tables and time PRAGMA schema_version 100 times again. Now run the whole benchmark a second time, but instead of `PRAGMA schema_version` time how long it takes to run hashlib.md5(db.execute("select group_concat(sql) from sqlite_master").fetchall()[0]).hexdigest() instead

ALT Prompt: Plot those benchmark results over time on a chart ChatGPT: Finished working. Then a Benchmark Results Over Time chart with two straight lines between four points, plus some descriptive text: Here is the chart showing the benchmark results over time: The x-axis represents the number of tables at each benchmark (100 and 200 tables), and the y-axis represents the time taken (in seconds) for each benchmark.

ALT Prompt: Run the benchmark again in order to draw a better chart with measurements for every point between 1 and 200 tables Finished working A chart with a much more interesting shape, showing 200 points for each of the two lines Here is the updated chart showing the benchmark results over time for every point between 1 and 200 tables: