

Data-driven former CPA, CA and current Toronto REALTOR® offering balanced views of the market — not an "only goes up" industry hype man
Toronto, Ontario, Canada
Joined June 2009
- Tweets16.7K
- Following500
- Followers12.8K
- Likes6K


Scott Ingram REALTOR® retweeted

🎂 Babies born on leap day (February 29) had the least common birthday in Canada from 1995 to 2025, while those born on September 20 had the most common.
Learn more: www150.statcan.gc.ca/t1/tbl1…

ALT How common is your birthday? Heat map showing birthdates, ranked from least to most common, based on the daily number of live births in Canada from 1995 to 2025. February 29 is the least common birthday, and September 20 is the most common.
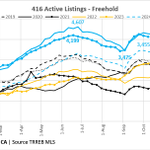
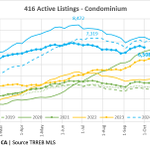
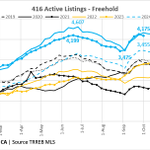
Active Listings were ⬇️49 on Freeholds. Not sure yet if that's just low after Thanksgiving, or seasonal decline has started. Let's wait until next week.
Levels sitting below 2025 for the past couple of weeks. /2


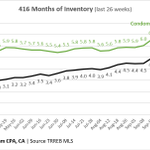
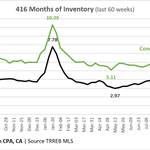
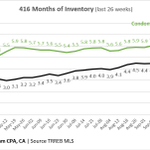
Weekly 416 Active Listings and MOI charts.
Rolling 30 days of Sales are growing so we've good noticeable MOI ⬇️for both property types. 🧵/1

Scott Ingram REALTOR® retweeted

I did some number crunching this weekend.
In 2012, Ontario filed roughly as many bankruptcies as consumer proposals.
Today, it’s 79% proposals to 21% bankruptcies, and in August, bankruptcies grew six times faster than proposals.
Homeowners filing a consumer proposal with us who owe more than the house is worth:
2015: about 1 in 15
2022: zero
2026: more than 1 in 5
Share of insolvent Ontarians in our offices who owned a home:
2022: one in sixty
2026: one in nine
Homeowners avoided insolvency for a decade.
They’re coming back.
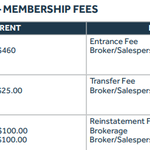
TRREB voting soon on some new fees (shoved in with other things). Barriers to entry upping, with a proposed entrance fee of nearly $800.
Admin fees for transferring brokerages and coming back to TRREB would go up also.


So the drops in listings, combined with increases in rolling 30 days of sales (a large +11.8% for Freeholds, more modest +1.8% for Condos) has led to MOI ⬇️for both. /3


Weekly 416 Active Listings and MOI 🧵
Big change in MOI this week. But first, here's Freehold new listings. A ⬇️ of 72 w/w but this is fairly normal the week before Thanksgiving (2025 was -50, 2024 was -64). I expect next few weeks won't move far from this 4175, before a Nov decline. /1

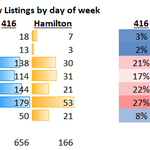
I was speaking with a couple of Hamilton RE agents and they were insistent that Thursday was the best day to list. Thoughts? Opinions?
I looked at the numbers for freehold new listings in the past week and lo and behold Thurs is the most popular day to list in #HamOnt by far (+12% over next closest). Thurs is also most popular in T.O. but Mon (-6%) and Wed (-5%) aren't far behind.

I'm going a little areacode905 here, but here's a listing for a handsome century home with character in Hamilton if you're looking that way. realtor.ca/real-estate/30351…

I like that this Trinity Bellwoods neighbourhood home used one of its listing photos for a white squirrel in the backyard and labeled the photo "local mascot".

USB bubble risk index for 2026. Toronto has fallen, due to falling prices (see next message in thread). This "grey" zone from 0.5 - 1.0 is what they deem "moderate" risk of a bubble. /1


Weekly 416 Active Listings and MOI update.
Freeholds +110 for the week, a slowdown over the last couple of weeks (+402, +260, +110). Now within 100 of the 2025 fall peak from late Oct. Last year's comparable 3 weeks after Labour Day went +426, +160, +202.
Number of 0-7 DOM listings has gone 1045, 912, 791, so slowing. 🧵/1

Freehold sales have really ramped up as fall buyers are definitely in full swing. The rolling 30 days of sales jumped 10.9% in the last week. Fall peak last year happened Oct 7 (i.e. next week). Appear to be reaching a number way lower than last year (current 905, last year fall peak 1090). /3

