

We help lenders expand homeownership through private mortgage insurance. Follow us to track industry trends, data and valuable tips on growing your business.
- Tweets2.2K
- Following129
- Followers811
- Likes480





ALT HAMMR DIGEST Chart of the Week: Business Activity. Line graph from Sep-04 to Sep-26, titled \"No Mistaking the Broad-Based Surge in Activity, but Can It Last?\". Blue (ISM), gray (FRB Regional Composite), and red (ISM Hard Data) lines fluctuate, generally above a 50-point dotted line, showing a recent upward trend. Logos: Arch | MI.

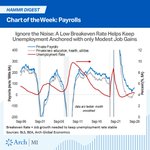
ALT HAMMR DIGEST Chart of the Week: Payrolls line graph (Sep-96 to Sep-26). Private Payrolls (blue) and Private less education, health, utilities (grey) show sharp drops during recessions, inversely correlating with Unemployment Rate (red) spikes, followed by recovery. A low breakeven rate helps anchor unemployment.

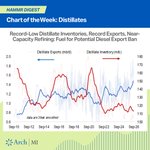
ALT HAMMR DIGEST: Chart of the Week: Distillates. A line graph shows Distillate Exports (blue, mb/d) and Inventory (red, m/b) from Sep-2010 to Sep-2026. Exports rise significantly while inventory falls, indicating 'Record-Low Distillate Inventories, Record Exports,' fueling potential diesel export ban. Logo: Arch MI.

ALT Line graph of FOMC Diffusion Index (2007-2026). Titled 'Fed's Hawkish Pivot...', it plots 'Change in real GDP', 'Unemployment rate', and 'Core PCE inflation'. Index > 0 indicates upside risk. The red line (Core PCE) is frequently above 0 from 2020.

ALT Chart: 'Fed Policy Outlook Back in Driver's Seat for 10y UST Yields.' Line graph shows rolling 5d correlation (Mar-Sep). 3yr1yr OIS (blue) & 1y1yr OIS (gray) correlations stay high (0.85-1.00). Brent Oil (red) correlation fluctuates, with recent dip then rise.

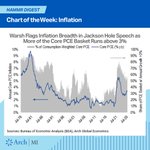
ALT HAMMR DIGEST: Inflation Chart. Warsh Flags Inflation Breadth in Jackson Hole Speech as More of the Core PCE Basket Runs above 3%. Line and area chart shows Annual Core PCE Inflation & % of Consumption-Weighted Core PCE from 1976-2026, peaking in early 80s & 2021-2022. Sources: BEA, Arch Global Economics.


