

Where structure, liquidity & human error converge. Est. ’16 @AlienTradingLab | Free trading journal ↓
Outlier
Joined March 2022
- Tweets13.6K
- Following51
- Followers22.2K
- Likes21K






Alien OPS retweeted
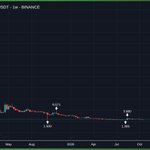
The $BTC.D outlook is shifting, and we’re approaching weekly confirmation.
You already know what that would imply. Most people may not even recognize the rotation until it is already underway.
The last time this signal confirmed, BTC.D dropped by roughly 36%. This time, I believe even half of that move would be significant enough.
This may be the only pair you genuinely want to see collapse.
Reassess your focus and bookmark this.
You’ll need it later.

Alien OPS retweeted
$BTC
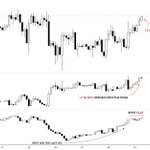
For the remainder of 2026, I believe a price path like this is a realistic possibility.
The key requirement is a confirmed CISD, followed by bullish continuation.
At first, many participants may conclude that "the bottom is in." However, in this scenario, the upside serves a different purpose: harvesting liquidity, completing the macro discount-to-premium cycle, and setting the stage for the real capitulation after a premium sweep.
I've tried to make the roadmap as clear as possible. Every major move on the chart is explained and supported by its underlying reasoning.
I know this isn't the type of price action CT is expecting, which is exactly why I find it interesting.
That said, the higher-timeframe structure still looks weak. A bullish continuation is less likely than a bearish resolution, but if the required conditions are met, it remains a valid possibility. Market makers rarely reward the consensus.
Under this scenario, ETH and altcoins could continue to outperform BTC, giving room for a meaningful mini bullszn before the macro trend resumes.
My long-term view remains unchanged: I still believe $BTC has a high probability of trading below $50K before the end of 2026.


Alien OPS retweeted
The thesis remains unchanged for $BTC.
Retail still expects a quick bottom, while BTC.D continues to show signs of weakness.
The cycle is evolving, yet the majority continues to focus on the wrong narrative.
The math hasn't changed.
Neither has my outlook.🔒


The math made it obvious for $BTC.
Bot accounts shilling Bitcoin = Moving toward 0.8 level
The cycle appears over with BTC.D weakening fast.
Nobody wants to see it.


Alien OPS retweeted
bitcoin:native - Short Trades +15RR.🔒
These are the types of trades you should have been looking for after HTF reversal confirmation.
Sharing this for educational purposes and as a lesson in execution.
Every one of these setups was posted in @AlienTradingLab🧪
If you'd like to learn, trade or become part of the family, we'd be happy to have you.


Alien OPS retweeted
$BTC | Monthly Outlook.📊
*Price continues to trade inside the monthly FVG, while also positioning itself at a significant resistance zone from a S/R perspective.
*I’ve highlighted the potential targets on the chart should we see a monthly close below this area.
-The Market Maker Sell Model still appears incomplete.
After such a major liquidity event, consolidation remains the highest-probability scenario.


Alien OPS retweeted
$EURUSD
I'm expecting price action similar to this.
PH is marked as indicated.
👇trade Fx with me;
u.primexbt.com/alienops


Alien OPS retweeted
$BTC
Once they grasp the macro cycle, the opportunity will have passed.
Consolidation doesn't finish in a handful of candles.
Time heals and reveals all.
Patience will pay off.
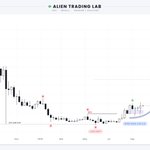
$BTCUSDT | Weekly | ETF Cycle
If you're trying to swing trade Bitcoin, this chart is for you.
Spoiler: every single one of them will fail.
The market will hand you multiple "entry opportunities".. each one looking more convincing than the last. As the consolidation drags on, you'll get impatient. Then frustrated. Then you'll start blaming the market.
That frustration isn't a side effect. It's the mechanism.
The real move comes during the LRB phase. But by then, you'll already be out; stopped, liquidated, or just mentally done.
The structure doesn't care about your analysis.
It was built to destroy it.

Alien OPS retweeted
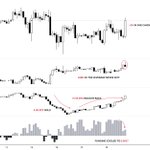
$BTCUSDT | Weekly📊
MS- confirmed. First weekly FVG delivered.
One left $80–84K. That's the last retracement level before price has nothing to hold onto.
Original consolidation is the target. Sellside liquidity has been waiting since 2024.
The model is in progress.
