AgingResearch.News (@agingbrief) header
AgingResearch.News (@agingbrief) profile picture

Every new aging study, read for you: who was studied, what changed, the catch. The strongest ones here as they appear. Free at https://xitter.cf/t.co/7UZKJa719C

Joined October 2026
Photo by AgingResearch.News (@agingbrief)Photo by AgingResearch.News (@agingbrief)Photo by AgingResearch.News (@agingbrief)Photo by AgingResearch.News (@agingbrief)Photo by AgingResearch.News (@agingbrief)Photo by AgingResearch.News (@agingbrief)Photo by AgingResearch.News (@agingbrief)Photo by AgingResearch.News (@agingbrief)Photo by AgingResearch.News (@agingbrief)Photo by AgingResearch.News (@agingbrief)
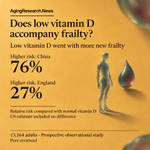
Losing independence with age is a reason to care about vitamin D beyond bones. Adults with low blood levels had a 76% higher relative risk of becoming frail in China than those with normal levels. Earlier studies found that people with lower vitamin D were more likely to be frail. Vitamin D helps maintain muscle function as well as bones. The new study included 13,164 adults: ages 65 or older in China and 50 or older in England and the US. Follow-up ran from 2012 to 2018 in China, 2012–2013 to 2016–2019 in England, and 2016 to 2020–2022 in the US. Frailty was scored by accumulated health problems. Low blood vitamin D meant 50 nanomoles per liter or less. Against levels above that cutoff, the relative risk of new frailty was 76% higher in China and 27% higher in England. The US result could be chance. Higher vitamin D went with less new frailty most clearly among more active people. Poorer health could itself lower vitamin D. Excluding people who became frail within the first 2 years barely changed the results in England and the US; China had too few eligible people and cases for this check. The next test is whether raising low vitamin D actually prevents frailty.
🤖 Made with AI
1
2
Sources and notes Association of Serum 25‐Hydroxyvitamin D With Frailty Across Three Prospective Cohorts: Effect Modification by Physical Activity. Food Science & Nutrition. Published paper. DOI: 10.1002/fsn3.72589 agingresearch.news/s/u6t9rk Prospective observational cohorts: China, 2038 adults aged ≥65, from 2012 to 2018; England, 6061 aged ≥50, 2012–2013 through 2016–2019; US, 5065 aged ≥50, 2016 through 2020–2022. Low/normal group sizes are not given. Low vitamin D: ≤50 nmol/L; normal: >50 nmol/L. Frailty index (FI): accumulated health deficits; new frailty: FI ≥0.25 among initially nonfrail participants. Adjustments: age, sex, education, income, marital status, smoking, drinking, diabetes, hypertension, body mass index, activity; season in China/England. China/England/US order below; parentheses give 95% confidence intervals. Low versus normal vitamin D, new-frailty hazard ratios: 1.76 (1.19–2.60), 1.27 (1.08–1.50), 1.05 (0.86–1.27). Per 10 nmol/L higher vitamin D: 0.86 (0.77–0.95), 0.95 (0.92–0.99), 0.97 (0.95–0.99). Baseline FI increases with low levels: 0.013 (0.005–0.022), 0.010 (0.004–0.015), 0.020 (0.011–0.029). FI reductions per 10 nmol/L: 0.006 (−0.008 to −0.004), 0.003 (−0.004 to −0.001), 0.002 (−0.003 to −0.001); intervals describe signed changes. Low levels also accompanied higher prevalent-frailty odds. Baseline relationships were nonlinear: overall/nonlinear p < 0.001 in China; p < 0.01 in England/US. FI plateaued in China and turned slightly upward elsewhere. New-frailty relationships showed no clear nonlinearity. Activity interactions appeared for continuous vitamin D across cohorts, with stronger new-frailty relationships among active participants; England's categorical baseline analysis found no interaction. Sensitivity hazard ratios per 10 nmol/L: - Complete cases: 0.88 (0.80–0.98), 0.95 (0.92–0.99), 0.98 (0.95–1.00). - Restricting England/US to ages ≥65, requiring repeated follow-up, and excluding early frailty over 2 years in England/US left results broadly unchanged. - Accounting for death: China 0.90 (0.82–0.99); US 0.98 (0.96–1.00). - Discrete-time models: 0.86 (0.78–0.95), 0.93 (0.89–0.97), 0.97 (0.94–0.99). - FI ≥0.21: 0.94 (0.87–1.02), 0.92 (0.89–0.95), 0.98 (0.95–1.00). Low-versus-normal analyses remained consistent. Authors' limits: - Poorer health and other participant differences could explain the relationships. - Vitamin D measures and laboratory methods differed. - Seasonal influences remained; US collection dates were unavailable. - Vitamin D was measured only at enrollment. - Frailty indicators differed across countries. - Findings exclude younger age groups.
6
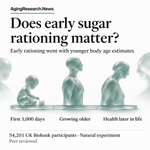
Your child's health in old age feels a long way off. Yet people exposed to sugar rationing in their first 1,000 days later had lower risks of cloudy eye lenses and chronic kidney disease. Food early in life is part of a much longer aging story. Earlier human studies tied early sugar rationing to lower death rates and younger age estimates for the body and its organs. This natural experiment used the abrupt end of postwar sugar rationing to compare early-life exposures among 54,201 UK Biobank participants. It examined biological age, an estimate of how old the body is, relative to age in years. Exposed people had lower age estimates relative to their years than unexposed people. The pattern was stronger with longer exposure and in females, and persisted across groups with different inherited risks. Risks of cataracts, a clouding of the eye’s lens, and chronic kidney disease were lower too. Several other diseases showed no link. The paper does not give the size of these differences. Other early-life differences between people exposed and unexposed to rationing could have influenced their later health, leaving sugar’s own contribution unresolved. The finding puts early nutrition among the possible contributors to healthier aging across a lifetime.
🤖 Made with AI
1
6
Sources and notes Sugar rationing during the first 1000 days of life and biological aging and age-related diseases. Nature Communications; not a preprint. DOI: 10.1038/s41467-026-79639-7 agingresearch.news/s/gv2s2x The natural experiment included 54,201 UK Biobank participants and used the abrupt end of postwar sugar rationing to examine early-life exposure and later health. Comparisons concerned people exposed and unexposed to rationing, with attention to exposure duration during the first 1,000 days of life. Exposure was associated with lower biological age acceleration: a lower estimated biological age relative to age in years. The association was stronger with longer exposure and more pronounced in females. It remained consistent across groups with different genetic susceptibility. Exposure was also associated with lower risks of age-related cataract and chronic kidney disease, but not several other age-related diseases examined. The paper does not give numerical effect sizes, confidence intervals or p-values for these findings. - Other early-life differences between people exposed and unexposed to rationing might have influenced their later health.
2
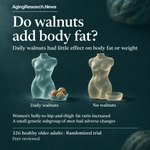
Adding 30–60 grams of fat-rich walnuts every day did little to older adults’ weight or body fat. They ate them for 2 years without being told to cut calories or replace other foods. Body fat tends to rise and muscle to shrink with age. Earlier reviews disagreed about walnuts and weight, leaving a practical question about adding a food so rich in fat. A randomized trial in Barcelona, Spain, included 326 healthy adults aged 63–79. They added 30–60 grams of walnuts daily or avoided walnuts for 2 years. Scans measured fat and fat-free tissue before and after. Weight, total fat and fat-free tissue changed much the same in both groups. Fat rose and fat-free tissue fell in both. Women’s ratio of abdominal to hip-and-thigh fat percentages rose 1.8% with walnuts and fell 0.7% without them. In an exploratory analysis, men with one version of an obesity-related gene gained more weight on walnuts than men with another version. That subgroup was small, leaving the genetic finding unsettled. Walnuts largely left the usual aging-related shift toward more fat and less fat-free tissue unchanged.
🤖 Made with AI
1
5
Sources and notes Effects of Long-Term Walnut Consumption on Body Composition in the Walnuts and Healthy Aging (WAHA) Randomized Clinical Trial. Nutrients. DOI: 10.3390/nu18223779. agingresearch.news/s/jt2h5u This pre-specified secondary analysis covered Barcelona participants in a randomized trial. Of 352 randomized, 326 completed: 163 per group, including 220 women and 106 men, aged 63–79. Participants added 30–60 grams of walnuts daily, approximately 15% of energy needs, or avoided walnuts for 2 years. No food substitutions or calorie restriction were prescribed. Whole-body X-ray scans measured fat and fat-free tissue. Analyses adjusted for baseline values and changes in physical activity. Mean body composition changes were <3% in women and <5% in men. The trial detected no between-group differences in weight, BMI (weight relative to height), waist circumference, total fat or fat-free mass. Fat increased and fat-free mass decreased in both groups. Women’s abdominal-to-hip-and-thigh fat percentage ratio increased 1.8% with walnuts and decreased 0.7% with control (p = 0.009). Leptin and adiponectin, blood markers related to body fat, showed no detected differences in change, nor did their ratio. Exploratory analyses tested FTO, an obesity-linked gene, at variant rs1861868. Men with its CC version had increased weight and BMI compared with T-version carriers after walnuts; weight, BMI and waist circumference also increased compared with controls carrying CC. Their BMI rose 1.9% and waist-to-height ratio rose 1.7%, with opposite changes on control. Women carrying CC had a decreased lean-to-fat ratio and increased leptin compared with T carriers. The BMI interaction p-value was 0.023. Other subgroup comparisons found no differences in BMI or fat-percentage responses by sex, age, baseline BMI, education, diabetes, physical activity or a blood marker of walnut intake. APOE, another gene tested for differences in response, showed no major differences in body composition or fat-related blood markers. - Only healthy older adults at Barcelona were included; younger people or different regional diets could give different results. - Genetic subgroup findings were exploratory and based on small samples. - The tested FTO variant marks genetic variation; the mechanism behind its response remains unresolved. - Detailed regional fat measurements, particularly fat around internal organs, were lacking.
13
When someone you love has depression, the worries can reach beyond mood to their future memory. Among 27,417 people, more physical symptoms of depression went with higher odds of dementia later on. Depression involves more than mood. Its physical symptoms are part of the search for clues to later dementia. The analysis covered 27,417 people across three long-term studies. It accounted for starting memory performance and assessed physical symptoms, depressed mood and positive feelings. Dementia required both impaired memory and needing help with daily activities. A 1-point higher physical symptom score went with 1.43 times the odds of later dementia compared with a score 1 point lower. The corresponding figure for depressed mood was 1.31. When all symptom groups were considered together, the physical-symptom link remained in all three studies. The mood and positive-feeling links weakened. The associations did not clearly differ by physical activity. The catch: identifying dementia through memory and daily-function measures could give different results from using clinical diagnoses. Physical symptoms deserve a distinct place in research on the relationship between depression and dementia.
🤖 Made with AI
1
11
Sources and notes Depressive symptom dimensions, physical activity, and incident dementia: a longitudinal analysis of three international cohorts. European Archives of Psychiatry and Clinical Neuroscience. Journal article, not a preprint. DOI: 10.1007/s00406-026-02415-7 agingresearch.news/s/wnqym6 The longitudinal analysis included 27,417 participants from the China Health and Retirement Longitudinal Study, English Longitudinal Study of Ageing, and Health and Retirement Study. Depression questionnaire items were grouped into physical symptoms, depressed mood and positive feelings. Dementia required concurrent memory impairment, using education-specific thresholds, and dependence in daily activities. Statistical models adjusted for starting memory performance, and results were pooled across studies using random-effects meta-analysis. Per 1-point higher score, the pooled odds ratio was 1.43 (95% CI 1.32–1.55) for physical symptoms and 1.31 (95% CI 1.22–1.40) for depressed mood. These compare the odds of dementia at higher versus lower symptom scores. When all symptom groups were modeled together, the physical-symptom association remained in all three studies; the depressed-mood and positive-feeling associations weakened substantially. Dose–response and sensitivity analyses supported the primary findings. The associations did not clearly differ by physical activity. Statistical mediation analyses estimated the share of the association passing through physical activity at 6.7–11.0% in the English study and 5.4–8.8% in the Health and Retirement Study. Estimates in the China study were imprecise. - Dementia was defined through memory and daily-function measures, so results may differ from those based on clinical diagnoses.
6
For anyone worried about keeping their brain healthy with age, sleep has a hidden rhythm: waves of fluid. In adults aged 60–84, those waves were weaker during sleep than in younger adults. Sleep and brain health are intertwined. During sleep, waves of brain activity help drive blood-volume changes that move fluid around the brain. The nighttime comparison included 31 adults aged 18–39 and 41 aged 60–84, without cognitive impairment or neurological or sleep disorders. Each had one to three scan runs lasting 25 minutes. Scans tracked cerebrospinal fluid, the liquid around the brain and spinal cord, entering the scanned area. Electrical recordings tracked sleep. During sleep without rapid eye movements, fluid-wave power, a measure of wave strength, rose by 3.82 decibels from wakefulness in younger adults, versus 1.15 decibels in older adults. Older adults also had weaker slow brain waves and smaller waves of blood-volume change. The age difference in fluid flow was greater during sleep than wakefulness. These were different age groups, so the scans do not tell us how anyone’s flow changes as they age. The finding puts brain activity and blood-vessel function together in the search for why nighttime fluid flow changes with age.
🤖 Made with AI
1
15
Sources and notes The aging human brain exhibits reduced hemodynamic and cerebrospinal fluid flow waves during sleep. Nature Aging. Published paper, not a preprint. DOI: 10.1038/s43587-026-01270-4 agingresearch.news/s/g24p7t Age-group comparison: nighttime brain scans and electrical recordings in 31 young and 41 older adults, with one to three 25-minute runs. Daytime experiments included 31 young and 55 older adults; 20 young and 32 older participants completed both. Visual electrical-response analyses included 28 young and 54 older adults; breath-hold analyses included 21 and 39, respectively. Models included age, sleep state and sex; checks added scan site and anatomy. Fluid-wave power increased from waking to sleep by 3.82 dB in younger versus 1.15 dB in older adults (P = 0.002); dB means decibels, a measure used here for signal power. The older group’s increase was not distinguishable from chance. Flow was lower in older adults during waking and sleep, with a greater age difference during sleep (interaction P = 0.025), across every sleep stage without rapid eye movements. Blood-volume wave power increased by 3.67 dB versus 2.15 dB (P = 0.038); its age difference was also greater during sleep (interaction P = 0.021). Older adults had weaker slow brain waves and weaker coupling between brain activity, blood-volume changes and fluid flow. Some older adults had young-like flow. Visual stimulation produced similar electrical responses but smaller blood-volume and fluid responses in older adults. Breath-holding also produced smaller responses. Daytime fluid responses to visual stimulation predicted nighttime flow (P = 0.005), as did blood-vessel reactivity (P = 0.014); within-group relationships held only in older adults. Less frontal gray matter accompanied lower flow in older adults; other lobes showed no clear relationship. Anatomy and systemic rhythms did not explain lower flow; motion did not explain weaker coupling. Site adjustment did not alter the models. Anatomical adjustments preserved daytime–nighttime relationships and mediation results. Slow brain waves mediated the age–flow relationship independently and through blood-volume waves; blood-volume waves did not independently mediate it after accounting for slow brain waves. An age effect remained. - Age groups were compared rather than individuals followed through aging. - Waste clearance was not measured. - Blood volume, blood pressure, hydration, sleep deprivation history and genetic risk factors were not measured. - Cognitive impairment and neurological or sleep disorders were excluded. - Whether reduced flow precedes or follows frontal tissue loss remains unresolved.
30
Could a kidney problem come with an earlier stroke? Among 381,886 people, those with long-term kidney disease had higher stroke risk, including at younger ages, and brain changes were visible before a stroke became apparent. Kidney disease already goes hand in hand with poorer physical function and thinking. Earlier studies also tie it to diabetes and older age. The study compared people with and without chronic kidney disease, using records for 381,886 participants with kidney function, urine protein and follow-up data. The relative risk measures were 1.61 for stroke and 1.89 for strokes at younger ages, with people without kidney disease as the comparison. More severe kidney disease came with higher risk. Brain scans also tied kidney disease to more abnormal areas in the tissue connecting brain regions, smaller brain volumes and lower brain blood flow before a clinically apparent stroke. Other health differences between people with and without kidney disease may have contributed to both the stroke and brain scan findings. Kidney disease could help flag people whose brains are vulnerable before a stroke becomes apparent.
🤖 Made with AI
1
1
1
6
Sources and notes Chronic kidney disease and long-term risk of cerebrovascular vulnerability. European Heart Journal Open. DOI: 10.1093/ehjopen/oeag205 agingresearch.news/s/gkjgft This population-based cohort study included 381,886 participants with kidney function, urine protein and follow-up data. It compared people with and without chronic kidney disease (CKD). Models of time until stroke examined CKD status, disease stage and kidney risk categories. CKD was associated with higher overall stroke risk: hazard ratio, a measure of relative risk, 1.61 (95% CI 1.50-1.73). For early-onset stroke, the hazard ratio was 1.89 (95% CI 1.62-2.22). Risk increased with more severe CKD, lower estimated kidney filtration, higher urine albumin relative to creatinine, and higher kidney risk categories. Kidney disease present at the start was also associated with more white matter lesions—abnormal areas in tissue connecting brain regions—smaller brain and gray matter volumes, and lower brain blood flow before a clinically apparent stroke. Blood protein analyses identified five candidate proteins associated with stroke among participants with CKD. WFDC2, a circulating protein, gave the highest AUCs, measures of how well predictions distinguish people who develop stroke from those who do not, for 3- and 5-year stroke prediction when added individually to traditional risk factors. Adding WFDC2 and HAVCR1, another blood protein, to traditional risk factors plus kidney filtration and urine protein measures increased the 3- and 5-year AUCs from 0.823 to 0.843 and from 0.792 to 0.816, respectively. Other health differences between the groups may have contributed to the stroke and brain-imaging findings.
1
7
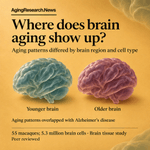
Picture 5.3 million cells inside monkey brains. Some kinds of nerve cells were scarcer in older animals, and aging patterns overlapped with Alzheimer’s disease, giving a glimpse of where the brain becomes vulnerable with age. Brain aging has its own timing. Earlier work in human brain tissue found changes in gene activity during development, stability in midlife and renewed changes in late adulthood. The new atlas maps gene activity—how actively cells use their genes—in 5.3 million brain cells from 55 rhesus macaques aged 0.5–21 years. It covers 582 tissue samples from 11 brain regions, comparing animals of different ages. Some types of nerve cells were less abundant in older animals than younger ones. The proportions of cells that support nerve cells also differed with age. Patterns of gene activity varied by brain region and cell type, and some differed by sex. Aging patterns overlapped with those seen in Alzheimer’s disease. Gene activity alone leaves open whether those shared patterns contribute to Alzheimer’s disease. The brains studied were from macaques, not people. The atlas gives researchers a reference for investigating when and where aging brain cells become vulnerable.
🤖 Made with AI
1
9
Sources and notes Single-cell, multi-region profiling of the macaque brain across the lifespan. Cell. DOI: 10.1016/j.cell.2026.09.014. agingresearch.news/s/i92gu9 The study profiled gene activity in 5.3 million individual cells from 582 tissue samples spanning 11 brain regions of 55 rhesus macaques aged 0.5–21 years. It compared age-associated patterns across brain regions and cell types, including differences by sex. Some neuronal populations—groups of cells that send nerve signals—were less abundant at older ages. Glia, cells that support neurons, showed subtle age-associated differences in their proportions, detectable only when examining individual cells. Age-associated patterns of gene activity included both shared and differing patterns across regions and cell types. Some patterns differed by sex. The aging patterns overlapped with those seen in Alzheimer’s disease. The authors proposed shared molecular roots, with windows of vulnerability differing by age, brain region and sex. - Gene-activity profiles alone cannot show whether the overlapping patterns contribute to Alzheimer’s disease. - The atlas covered rhesus macaques, not people.
1
9
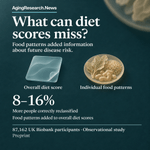
If you care about eating for a healthy heart, a diet score leaves something out. In 87,162 people, food patterns revealed differences in future disease risk that the overall scores missed. Heart disease, diabetes and kidney disease matter for health in later life. An overall diet score compresses what someone eats into a single number. The study, a preprint, not yet peer reviewed, followed 87,162 UK Biobank participants for a median 9.4 years. Reports of 148 foods and drinks yielded eight recurring food patterns, tested against overall diet scores for predicting disease in the heart’s blood vessels, type 2 diabetes and chronic kidney disease. Adding food patterns to diet scores correctly reclassified 8–16% more people by disease risk than using the scores alone. Adding scores to models already using food patterns brought negligible further improvement. More sugar and processed foods went with more diabetes and kidney disease. Plant foods and fish went with less kidney disease; cheese and whole grains went with less disease in the heart’s blood vessels. Other health or lifestyle differences between people could account for some of these links. The finding puts the foods behind the score in focus as a way to refine disease risk estimates for later life.
🤖 Made with AI
1
2
Sources and notes Food-level dietary factors reveal cardiometabolic risk hidden by diet quality scores. medRxiv preprint, not yet peer reviewed. DOI: 10.64898/2026.11.10.26367678 agingresearch.news/s/irxphh This observational analysis included 87,162 UK Biobank participants reporting intake of 148 foods and beverages, with a median 9.4 years of follow-up. A statistical method identified eight reproducible food-intake patterns. Models of time to diagnosis tested their relationships with coronary artery disease, type 2 diabetes and chronic kidney disease. Prediction models assessed what food patterns added beyond diet quality scores, and vice versa. Blood analyses covered 249 circulating metabolites, small molecules reflecting metabolism. Hazard ratios compare disease rates over follow-up; the ranges below are 95% confidence intervals. For sugar and processed foods, the hazard ratio was 1.19 for type 2 diabetes (1.11-1.27) and 1.15 for chronic kidney disease (1.07-1.23). For plant foods and fish, it was 0.90 for kidney disease (0.84-0.96); for cheese and whole grains, 0.94 for coronary artery disease (0.90-0.98). Food patterns improved disease discrimination, the ability to distinguish who develops disease, with ΔC up to +0.0049. Net reclassification improvement, a measure of improved risk classification, was 8-16%. Adding either diet score to models already containing food patterns produced negligible further improvement. The patterns were stable across geographically distinct samples. Blood profiles showed lower omega-3 fats with the sugar and processed foods pattern, and more polyunsaturated fats with the plant-based and fish pattern. - Other health or lifestyle differences between people may have contributed to their disease risk. - The analysis has not yet been peer reviewed.
1
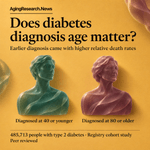
Is diabetes just as dangerous when it arrives late in life? In Finland, death rates were higher after diagnosis by 40 than among people without diabetes, but lower after diagnosis at 80 or older. Earlier studies found that diabetes diagnosed young came with more deaths and more heart and kidney disease. The excess risk tended to shrink as age at diagnosis rose. The Finnish study included 485,713 people with type 2 diabetes in national records from 2018 to 2023. Median follow-up was six years. Deaths were compared with those expected among Finns without diabetes, accounting for age and sex. With 100 representing expected deaths, the death ratio was 288 for people diagnosed at 40 or younger and 56 for those diagnosed at 80 or older. Across everyone with diabetes, it was 92: the overall result concealed very different patterns by diagnosis age. The comparison accounted for age and sex, but not other illnesses. Those illnesses could explain some of the difference between people with and without diabetes. Age at diagnosis can help identify which people with diabetes face greater risk as they grow older.
🤖 Made with AI
1
14
Sources and notes All-cause mortality and associated factors according to age at diagnosis of type 2 diabetes in Finland. BMJ Open Diabetes Research & Care. Peer reviewed. DOI: 10.1136/bmjdrc-2026-006329 agingresearch.news/s/8drekj Retrospective dynamic registry cohort: 485,713 people, 2018 to 2023; median follow-up six years; 82,431 deaths. Diagnosis groups: ≤40 years, 28 939; 41–79 years, 422 578; ≥80 years, 34 196. Comparator: Finns without diabetes. Death ratios adjusted for age and sex. Risk-factor models also included diabetes duration, blood sugar, cholesterol, kidney risk, cardiovascular and other complications, and medication use. Death ratios (100 = expected mortality; 95% confidence intervals): overall 92 (91 to 92); diagnosis ≤40: 288 (273 to 304); ≥80: 56 (55 to 57). Adjusted mortality rate ratios (95% confidence intervals): heart failure 2.07 (2.01 to 2.13); high/very high kidney risk 1.65 (1.61 to 1.70); peripheral artery disease 1.37 (1.32 to 1.42); female sex 0.69 (0.67 to 0.70); diabetes duration 0.97 (0.97 to 0.97); baseline age 1.06 (1.06 to 1.06); diabetic eye damage 0.73 (0.68 to 0.79); elevated average blood sugar 1.05 (1.02 to 1.08). Cholesterol showed no clear mortality difference overall. Medication associations: insulin alone 3.37 (3.10 to 3.67); insulin combinations 1.63 (1.52 to 1.75); non-insulin glucose-lowering drugs 0.92 (0.86 to 0.98); lipid-lowering drugs 0.57 (0.56 to 0.59); kidney-protective drugs 0.73 (0.71 to 0.75). These were prescribing comparisons, not treatment experiments. Sensitivity checks compared patient characteristics, without revised death ratios. Mortality with missing kidney measurements was 30% versus 10% with measurements. People with diabetic eye damage had more illnesses and treatment. Blood sugar predicted mortality in older diagnosis groups, but not the youngest group. - Other illnesses were unaccounted for in the population comparison. - Older diagnosis groups may include healthier survivors and milder cases found through screening. - Earlier diagnosis dates and disease duration could be inaccurate. - People with existing diabetes had to survive until 2018. - Illnesses recorded near death received the same weight as earlier diagnoses. - Prescriptions near death could obscure medication benefits; insulin prescribing reflected greater illness severity. - Smoking, body mass index and blood pressure were unavailable. - Missing laboratory measurements differed by health and care.
14
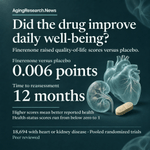
With heart or kidney disease, how you feel each day matters. Among 18,694 people with these illnesses, poorer quality of life went with more heart deaths or hospital stays for heart failure. Daily well-being matters alongside staying out of the hospital and living longer. Earlier studies have connected kidney disease with worsening physical function and thinking. Three randomized trials compared finerenone, a drug tested for heart and kidney outcomes, with placebo in adults with chronic kidney disease and type 2 diabetes, or heart failure. Starting quality-of-life questionnaires were available for 18,694 people, averaging 67 years old. The questionnaire's scale runs from below zero to 1; higher means better health. Each 0.1-point lower starting score went with greater risk of heart-related death or a hospital stay for heart failure. Finerenone's effect on that outcome was similar across starting scores. After 12 months, its quality-of-life score was 0.006 points better than placebo, with larger gains among people who started worse. People with poorer scores also had more illnesses and worse kidney function. Adjusting for other factors left the link in place, but those health differences could still help explain it. The result puts daily well-being alongside hospitalization and survival when judging treatment for these conditions.
🤖 Made with AI
1
3
2
114
Sources and notes Health-Related Quality of Life Across the Spectrum of Cardiovascular-Kidney-Metabolic Syndrome: Insights from Participant-Level Pooled Analysis of 3 Global Trials. AHA Scientific Sessions 2026 Abstract. Conference abstract, not a preprint. DOI: 10.1161/circ.154.suppl_1.5952 agingresearch.news/s/yesj7e Prespecified participant-level analysis of three trials that randomized adults to finerenone or matching placebo. Two enrolled people with chronic kidney disease and type 2 diabetes; one enrolled people with heart failure. Of 18,991 participants, 18,694 (98%) had starting quality-of-life scores: 5,531 and 7,185 from the kidney disease/diabetes trials and 5,978 from the heart-failure trial. Mean age was 67±10 years; 35% were women. The paper does not give treatment-arm counts. Quality of life was assessed at baseline and 12 months using EQ-5D-5L, a health-status questionnaire scored from below zero to 1, with higher scores indicating better health. Multivariable survival models assessed the relationship with cardiovascular death or heart failure hospitalization; the paper does not list their adjustment factors. Models of score changes adjusted for baseline values, trial, geographic region and randomized treatment. Mean starting score was 0.75±0.21. Lower scores went with older age, being a woman, higher body mass index, poorer kidney function and more coexisting illnesses (all P<0.001). Each 0.1-point lower score was associated with a higher risk of cardiovascular death or heart failure hospitalization: adjusted hazard ratio 1.10 (95% CI, 1.08–1.12; P<0.001). Finerenone's effects on that combined outcome were consistent across starting scores (interaction P=0.80). Similar findings were reported for major cardiovascular events, combined kidney outcomes and death from any cause; numerical estimates were not given. At 12 months, the quality-of-life difference favoring finerenone over placebo was +0.006 (95% CI, +0.001 to +0.011; P=0.017). Improvements were greater among people with poorer starting scores (interaction P=0.005). - Other health differences could have contributed to the relationship between poorer quality of life and later heart outcomes. - These findings concern people with chronic kidney disease and type 2 diabetes, or heart failure.
1
1
45