

We're the American Association on Health & Disability. Working with @AllofUsResearch @ndnrc + @Dis_Health to advance #DisabilityHealth #HealthEquity and #A11y
- Tweets6.5K
- Following2.4K
- Followers4.7K
- Likes1.7K






ALT #DisSky Building Community on Blue. Sky.

ALT Woman smiling at phone. Disability and Healthcare Survey. Help the government work for us. Take the GAO Survey by November 30th.

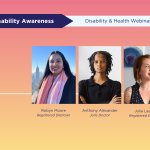
ALT Non-Apparent Disability Awareness - Disability and Health Webinar Series 2024-2025. Disability, Nutrition and All of Us. Speakers: Robyn Moore, Anthony Alexander, Julia Laakso, Eric Galloway. Hosted by AAHD and All of Us.

ALT Portrait of a woman stretching outside in front of a house.

ALT Webinar graphic for “Disability, Nutrition & All of Us", part of the Disability and Health Webinar series. November 20th at 2 PM ET/ 11am PT. “Join us for a discussion about how nutrition is a key area of health for people with disabilities.” ASL & CART will be provided. A portrait of a family of four seated at an outdoor table.

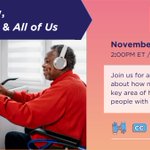
ALT Webinar graphic for “Disability, Nutrition & All of Us". November 20th at 2 PM ET/ 11am PT. “Join us for a discussion about how nutrition is a key part of health for people with disabilities”. ASL & CART will be provided. A man is chopping red bell pepper on his kitchen counter. He’s wearing headphones and seated in his wheelchair.

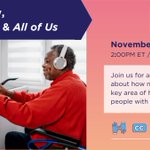
ALT Webinar graphic for “Disability, Nutrition & All of Us". November 20th at 2 PM ET/ 11am PT. “Join us for a discussion about how nutrition is a key part of health for people with disabilities”. ASL & CART will be provided. A man is chopping red bell pepper on his kitchen counter. He’s wearing headphones and seated in his wheelchair.

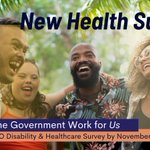
ALT New Health Survey. Help the Government Work for Us. Take the GAO Disability and Healthcare Survey by November 30th. Four people smiling.

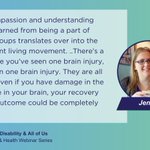
ALT Quote from Jennifer Williams from recent Autoimmunity webinar: “The compassion and understanding that I've learned from being a part of support groups translates over into the independent living movement. ..There's a saying once you've seen one brain injury, you've seen one brain injury. They are all different, even if you have damage in the same place in your brain, your recovery and your outcome could be completely different.”

ALT Open Enrollment - November 1st to January 15th. Graphic is halloween-colors with cobweb graphics in the corner.


ALT Text reads ”Project 2025 & its Impact on the Disability Community” with a bunch of hands with different icons crossed out that represent healthcare, housing and education” The DREDF logo is in the corner.

ALT All of Us Research Program photo of a woman standing outside in front of a stucco wall with flowers growing up it. She is using arm crutches.

ALT CCD - Consortium for Constituents with Disabilities - Task Force Co-Chairs Statement on Project 2025


ALT We’re connecting on LinkedIn. Follow us for research updates & engagement with readers and authors.

ALT Disability and Health Webinar Series 2024-2025 for Non-Apparent Disability Awareness. Autoimmunity, Disability and All of Us. Speakers include: Jess L. Wilcox Cowing (Goucher College and University of Wyoming); Dr. Natalia Rivera Morales (George Washington U); Ashlee Brady-Kelly (Pathways Vermont); Jennifer Williams (Maine SILC).


ALT Graph showing the odds ratio of deaf and hard-of-hearing adverse childhood experiences. In the 25-to-34 age group (aOR = 2.98; 95 % aOR CI: 1.81, 4.92; P < 0.0001), 35-to-44 (aOR = 3.17; 95 % aOR CI: 1.98, 5.08; P < 0.0001), 45-to-54 (aOR = 1.74; 95 % aOR CI: 1.23, 2.45; P = 0.0016), and 55-to-64-year-old (aOR = 1.85; 95 % aOR CI: 1.41, 2.42; P < 0.0001) age groups, those who are DHH were significantly more likely than their same-age hearing peers to report a high-risk number of ACEs. The findings for the 18–24 years and 65+ age groups were not statistically significant.

ALT Transportation for people with IDD receiving HCBS Report Card. Icon image of a city bus with an X and check mark as headlights.

ALT States with highest spending per capita Ohio: Transportation provided? Yes; % of total people with IDD receiving HCBS transport: 115%; Total spending: $233,743,354; Spending per capita: $19.84 Maine: Transportation provided? Yes; % of total people with IDD receiving HCBS transport: 100%; Total spending: $19,557,897; Spending per capita: $14.25 California: Transportation provided? Yes; % of total people with IDD receiving HCBS transport: 57%; Total spending: $268,126,790; Spending per capita: $6.83 West Virginia: Transportation provided? Yes; % of total people with IDD receiving HCBS transport: 92%; Total spending: $9,051,947; Spending per capita: $5.08 Massachusetts: Transportation provided? Yes; % of total people with IDD receiving HCBS transport: 30%; Total spending: $34,268,247; Spending per capita: $4.91 Iowa: Transportation provided? Yes; % of total people with IDD receiving HCBS transport: 37%; Total spending: $14,158,545; Spending per capita: $4.43

ALT States with lowest spending per capita Louisiana: Transportation provided? Yes; % of total people with IDD receiving HCBS transport: 0.1%; Total spending: $3,613; Spending per capita: $0.0008 Illinois: Transportation provided? Yes; % of total people with IDD receiving HCBS transport: 0.6%; Total spending: $98,739; Spending per capita: $0.0008 Alabama: Transportation provided? Yes; % of total people with IDD receiving HCBS transport: 1%; Total spending: $25,296; Spending per capita: $0.005 Virginia: Transportation provided? Yes; % of total people with IDD receiving HCBS transport: 5%; Total spending: $223,374; Spending per capita: $0.03 Washington: Transportation provided? Yes; % of total people with IDD receiving HCBS transport: 2%; Total spending: $348,681; Spending per capita: $0.05 Hawaii: Transportation provided? Yes; % of total people with IDD receiving HCBS transport: 2%; Total spending: $100,747; Spending per capita: $0.07

ALT States with no HCBS transportation: Arizona, North Carolina, Rhode Island, Vermont, Wisconsin, Wyoming