

Counting people on bikes in Ann Arbor | A project by @fenggroup
Ann Arbor, MI
Joined May 2023
- Tweets15
- Following2
- Followers32
- Likes1
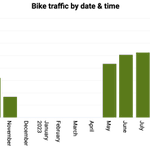
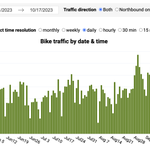

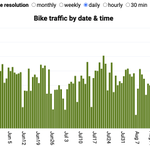




Monthly summary (October 2023): 12,405 bike trips counted at our Division bike counter (2nd highest month)
Average daily trips: 400
Peak day: Tue, Oct 3
Peak count: 689 (all time high)
Dashboard: bikecounter.org/annarbor-1


Monthly summary: 15,644 bike trips counted in September at our Division bike counter (all time high)
Average daily trips: 522
Peak day: Thu, Sep 21
Peak count: 668
Dashboard: bikecounter.org/annarbor-1

This is the first time we have the same month's count from multiple years. The Sep 2023 count (15,644) is an 86% increase from Sep 2022 (8,407). We believe it's partly attributed to the increased connectivity thanks to the recent Catherine/Miller & other downtown bike projects.
1
4
134
We see a significant increase in bike trips during the first three weeks since the UMICH fall semester started on Aug 28.

3
70
Monthly summary: 11,372 bike trips counted in August at our Division bike counter (all time high monthly count)
Average daily trips: 367
Peak day: Wed, Aug 30 (first week of UM fall semester)
Peak count: 673 (also the all time high)
Dashboard: bikecounter.org/annarbor-1

3
135
Monthly summary: 10,502 bike trips counted in July at our N Division bike counter (all time high monthly count)
Average daily trips: 339
Peak day: Friday, July 21
Peak count: 508 (also the all time high)
Dashboard: bikecounter.org/annarbor-1

Monthly summary: 10,138 bike trips counted in June at our N Division bike counter (all time high monthly count)
Average daily trips: 338
Peak day: Thu, June 1
Peak count: 449 (also the all time high)
Dashboard: bikecounter.org/annarbor-1

1
151
2,521 bike trips counted in the week of June 19 #A2DivisionBikeCounter Dashboard: bikecounter.org/annarbor-1

65
In the week of June 12, the Division bike counter logged 2,300 bike trips. Dashboard: bikecounter.org/annarbor-1

1
3
292
In the week of June 5, our Division bike counter logged an all-time second-highest weekly count of 2,525 bike trips (despite the raining Sunday). Dashboard: bikecounter.org/annarbor-1

Monthly summary: In May 2023 our bike counter at Division protected bike lane logged 8,681 bicycle trips.
Average daily trips: 280
Peak day: Thu, May 11
Peak count: 427 (also the all time high since the counter was up in Aug 2022)
Interactive dashboard: bikecounter.org/annarbor-1
