

Visual Data Journalist @TheEconomist. Formerly making climate change #dataviz for @CarbonBrief. Views are my own.
Joined October 2013
- Tweets714
- Following2.1K
- Followers8.7K
- Likes1.2K





Pinned Tweet
Bees practice social distancing when their hive is infected with mites
#dataviz with @AinslieJstone economist.com/graphic-detail…

Even without labels you can still see where the cities are
economist.com/interactive/fr…
Rosamund Pearce retweeted

🗳️📈🇫🇷Follow the French elections with @TheEconomist’s poll tracker. From @_rospearce, the excellent special-projects team and me economist.com/interactive/fr…

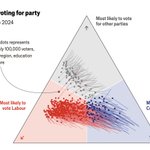
Explore how different groups are likely to vote in the next British election (spoiler: there's been a huge shift to Labour)
Had a lot of fun building this tool with @JamesFransham and @futuraprime
#BuildABritishVoter economist.com/interactive/uk…
This chart shows how support for the Tories has ebbed away
economist.com/britain/2024/0…

This was a fascinating dataset to work with: explore who dating app users say they're willing to date vs who they actually like.
With @doug_dowson economist.com/graphic-detail…
One of those maps that you can get lost in.
It uses satellite imagery originally designed to detect forest fires to map the extent of the war in Ukraine.
With @Sondreus and @MatterofMatt economist.com/interactive/20…

Rosamund Pearce retweeted

There is no question about the bravery of Iranian protesters. But what is less clear is how widespread the protests are, if they are still growing - and how they might end. I looked at data on tens of thousands of events to find out (charts: @_rospearce ) economist.com/graphic-detail…

This map shows how many days of "very strong" or "extreme" heat stress each region had on average per year between 2017-22
#dataviz with @AinslieJstone economist.com/graphic-detail…


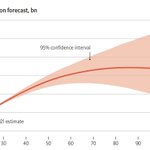
The distribution of humanity across the world is set to shift dramatically, according to the UN's population forecast.
As China shrinks, India will continue to add citizens.

The population of Europe, the world’s oldest region, is forecast to decline. Africa, the youngest region, will account for 25% of the world's population by 2050.

It's worth remembering that these forecasts come with uncertainty.
Read the full story here: economist.com/graphic-detail…

Nearly half of Mariupol's built-up area has been damaged 🔴 since the war began.
This map is so detailed that editing it was almost too much for my laptop
economist.com/graphic-detail…

Most data comes with some uncertainty, yet it looks definitive when plotted on a chart. Making this uncertainty visible is one of the trickiest aspects of #dataviz
I've written a brief intro to some of our approaches @TheEconomist in our data newsletter view.e.economist.com/?qs=47a…

The war in Ukraine has made tweets in Russian unusually glum
#dataviz with @AinslieJstone economist.com/graphic-detail…

Rosamund Pearce retweeted

Thanks to all the graphic reporters who map what's going on in Ukraine on this sad day.
🧵 Here's a thread of their maps. My screenshots will be outdated soon, so click the links for the updated versions. If you know of other sources, add them.

ALT Map of current attacks on Ukraine, created by the New York Times
Keep thinking about this chart I drew up last week, which shows how different Omicron is to other variants
economist.com/briefing/2021/…

