

Cutting-edge geospatial intelligence company dedicated to revolutionizing the industry with AI-driven solutions. Founded in 2023.
Joined September 2023
- Tweets388
- Following70
- Followers39
- Likes36






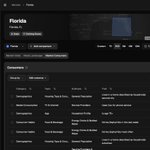



Which other brands do your shoppers visit? Almanac’s rebuilt Cross-Shopping shared shoppers across brands, markets and individual store trade areas.
Explore the guide: eu1.hubs.ly/H0z8nbZ0
#RetailAnalytics
Ready to test our platform on your own terms?
📩 Send us a message to get started with Test & Learn. eu1.hubs.ly/H0yX0gM0

A site with 95% of your required foot traffic isn't 5% less attractive. 🛑
Strict screening cutoffs create false negatives—rejecting locations for barely missing a single metric.
See why rigid thresholds cost you growth: eu1.hubs.ly/H0ygs7V0

The retail stores you didn't open might be costing you in lost ROI. 🏪📉
When screening criteria reject a site for missing a foot-traffic threshold it can become a competitor's success!
Discover how to eliminate screening blind spots: eu1.hubs.ly/H0ygpKn0
#CRE

No dashboards. No context switching.
Work-ready visuals: Get inline charts, tables, and maps right inside ChatGPT, Claude, or Copilot!
Try Otto: eu1.hubs.ly/H0ydf2f0
#Productivity
Is US footwear retail finally finding its floor? 👟
- Steepest state drop: Oklahoma -9.93% YoY
- Most resilient state: Wyoming -2.73% YoY
- Foot Locker visits fell 5.93% YoY
📊 Read the full report for the state-by-state breakdown: eu1.hubs.ly/H0y9QyZ0
#RetailAnalytics

🚀 Meet Otto, a new way to work with your retail data.
Ask questions in plain language, get answers, and turn them into tables, graphs or maps — without leaving the conversation.
Otto is rolling out to all users today.
Ask a question. Get an answer.
eu1.hubs.ly/H0y2Kk10

We're asking “Who are we still attracting — and how is that changing?” in our latest report. passby.com/blog/are-discount…
#RetailIntelligence #FurnitureRetail #FootTraffic

🛋️ Are furniture retailers attracting high-income shoppers?
Furniture traffic is down 2.99% YoY but the share of $100K+ visitors remains stable: 24.57% → 24.36%.
eu1.hubs.ly/H0xWMR60


🚀 Markets, reimagined.
We’ve rebuilt Markets in Almanac to give you deeper insight into:
📊 Category & competitor performance
🗺️ Market white space
👥 5,000+ consumer datapoints
📈 Market benchmarking
See how the new Markets works for you 👇
eu1.hubs.ly/H0xLWJX0

🚀 New Markets features are now live in Almanac.
👥 5,000+ consumer datapoints
📊 Custom market benchmarking
📍 White space analysis
Sign in to Almanac to see the changes!
#RetailIntelligence #LocationIntelligence #RetailAnalytics


🚀 Markets just got a major upgrade.
PassBy users can now:
📊 Build custom competitive benchmarks
📍 Analyze white space down to the retail-area level
👥 Explore 5,000+ consumer datapoints
Sign up now:
#RetailTech #LocationIntelligence #RetailAnalytics

ALDI’s US expansion is accelerating. Our latest analysis found:
📈 Double-digit YoY growth
🏪 100K+ monthly visits at its first Maine store
📍 6K daily visits at new Phoenix location
Read the full report: eu1.hubs.ly/H0xD0lD0
#ALDI #Retail #FootTraffic #RetailAnalytics

Looking for foot traffic software? Make sure your provider has:
✅ A user-friendly platform
✅ Data you can trust
✅ AI integrations that help you find insights faster
PassBy delivers all 3. Read the full blog 👇
eu1.hubs.ly/H0xwVS60
#FootTraffic #RetailTech

Who lives near your store ≠ who shops there.
Stop making #retail decisions based on demographics alone.
Learn how visitation-based audience segmentation reveals who visits, who doesn't, and who's choosing your competitors.
Read the guide 👉 eu1.hubs.ly/H0xtlyt0

Every retailer has the same challenge. You have your own store performance data. You have market intelligence. But bringing the two together means spreadsheets, exports & manual analysis.
That's the problem we've solved with Your Almanac: eu1.hubs.ly/H0x8ygv0

Choosing the right shopping mall is about more than location—tenant mix drives foot traffic and performance.
With PassBy's AI & platform, you can evaluate any mall in minutes using AI or dive deeper with foot traffic, tenant mix visualizations, and CSV exports.

Smarter site selection starts with better data. 📍🏬
Evaluate a mall's tenant mix with PassBy: passby.com/blog/how-to-evalu…
