
CIO, Personal & Business Banking and Wealth Management @ABN AMRO Data-driven US macro, Fed & rates analysis | Open Jupyter notebooks → https://xitter.cf/t.co/tEcd9HC5H0
The Hague, South Holland
Joined November 2009
- Tweets1.8K
- Following43
- Followers100
- Likes614


Pinned Tweet
With the last trading day of September done: S&P 500 market cap hits $68.84T, up $7.44T (+12.1%) YTD. That’s ~211% of US GDP (up 16.3 pp). The top 10 companies by market cap make up ~41% of total #SP500 capitalization—a remarkable concentration. Their market cap is up 12.4% YTD.


Deep dive in last week’s Economist. When g > r (nominal GDP growth exceeds the average yield on a country’s debt), the existing debt stock shrinks relative to GDP. For the US this gap has narrowed but remains favourable.
#Economy


The most troubling force pushing up yields is political and fiscal risk. America is getting off lightly. Elsewhere, markets are proving less forgiving economist.com/briefing/2026/…

However this is not enough if the country runs a primary deficit…
For the US the primary deficit is ≈2.2% of GDP (end-Q2). So the debt-to-GDP ratio is still set to rise from its current 97.5% level, even while g > r.
xitter.cf/_ilchen_/status/210127…
#USDebt

And on the debt itself:
Public debt stood at $31.68 trillion at the end of Q2, or 97.5% of GDP. That is below the COVID peak of ~103%, but with persistent deficits, a return above 100% looks increasingly likely in the coming years.
Full analysis: github.com/ilchen/US_Economi… #USDebt

Markets have sharply repriced the #Fed path higher since mid-Sept.
As of Oct 15 vs one month earlier:
• Futures-implied Fed funds next year: +≈17 bp → now 4.50–4.75% range
• Forward 10y Treasury yield: +≈10 bp
Chart shows past path + current vs prior-month futures/forwards

The #FED just dropped September’s Industrial Production data. Q1-Q3 2026 growth averaged +1.36% YoY (Manufacturing +1.12%, Mining +1.89%, Utilities +2.35%). Capacity utilization 76.1% (Manufacturing 75.6%, Mining 86.3%, Utilities 70.8%).
#USEconomy #IndustrialProduction

Within Durable Manufacturing, Computer and Electronic Products is now at one of its highest shares since the early 1970s — a clear footprint of the AI infrastructure build-out.
#Manufacturing #AI

Utilities is also at one of its highest shares of total US Industrial Production in decades. Rising electricity demand from AI and data centres is visible in the data.
Full analysis: github.com/ilchen/US_Economi…
#IndustrialProduction #AI

With actual CPI at 3.7%, markets now expect inflation to average ~3% over the next year (Cleveland Fed), up ~30 bp from a month earlier. Longer-term expectations also rose ~12 bp toward 2.7%.
Markets have grown more sceptical the Fed will bring inflation back to 2% this decade.

Fresh US CPI data — September Consumer price inflation rose to 3.7% YoY — significantly above the Fed’s 2% target. The 3-month annualized rate over Q3 rose to 4.6%.
Full charts, data & code: github.com/ilchen/US_Economi…
#CPI #Inflation #Economy


Fresh US CPI data — September Consumer price inflation rose to 3.7% YoY — significantly above the Fed’s 2% target. The 3-month annualized rate over Q3 rose to 4.6%.
Full charts, data & code: github.com/ilchen/US_Economi…
#CPI #Inflation #Economy
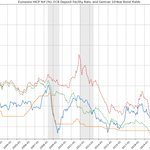
A big ≈23 bp increase in #Eurozone risk-free #InterestRates (derived from traded AAA-rated govt bonds — DE, NL, LU) in September vs August across maturities:
• Short-term (<3y): 2.64% → 2.96%
• Long-term (>3y): 3.48% → 3.70%
Full analysis: github.com/ilchen/EU_Economi…

🇪🇺 #Eurozone HICP & Govt Bond Yields for Sep:
• 10-year German Bund yield: 3.19% → 3.47%
• 10-year Italian BTP: 3.99% → 4.36%
• Inflation: 3.3% → 3.8% YoY. Q3 annualised came at 5.1%
Big increases of ~30-50 bp in just 1 month.
More: github.com/ilchen/EU_Economi…
#HICP #Inflation


Interesting to look at US payroll changes since end-2025.
Some of the sectors with the highest AI exposure — Information and Financial activities—are among the largest job losers, while Healthcare, Social assistance, and Construction continue to lead gains.
#Jobs #LaborMarket #AI

Source & full analysis:
github.com/ilchen/US_Economi…
How to run it (incl. one-click Google Colab):
github.com/ilchen/US_Economi…

China was once the largest foreign holder of US public debt. It’s been steadily selling: –$66bn in the first 7 months of 2026 alone.
It’s already slipped to 3rd place. If the trend continues, it will likely fall to 4th within a few years.
#USDebt #ForeignHoldings #China

Source & full analysis:
github.com/ilchen/US_Economi…
For instructions on how to run it (including one-click in Google Colab): github.com/ilchen/US_Economi…

September jobs report:
Labor force participation rose 0.2 pp to 61.8%, while the unemployment rate edged up 0.1 pp to 4.2%.
Participation remains well below its long-term mean (~64%) and pre-pandemic levels. A full recovery to those earlier rates looks unlikely.
#LaborForce


On the other hand, the unemployment rate remains well below its mean since 2001 (~5.7%).
This partly compensates for the lower participation rate, keeping the employment-population ratio comfortably above the lows of the early 2010s and the pandemic trough.
Thanks for reading!🧵
xitter.cf/_ilchen_/status/210639…
Full analysis + interactive notebook: github.com/ilchen/US_Economi…
How to run it (including one-click in Google Colab):
github.com/ilchen/US_Economi…
September jobs report:
Labor force participation rose 0.2 pp to 61.8%, while the unemployment rate edged up 0.1 pp to 4.2%.
Participation remains well below its long-term mean (~64%) and pre-pandemic levels. A full recovery to those earlier rates looks unlikely.
#LaborForce


RMP has all but stopped growing the Fed’s balance sheet, in line with Chairman Kevin Warsh’s criticism that it remains oversized.
Full charts + analysis:
github.com/ilchen/US_Economi…
#Fed #BalanceSheet #MonetaryPolicy
