Animal ecophysiologist, marine biology, and conservation. #Postdoc at The Australian Institute of Marine Science (he/him). Views are my own. 🇦🇺🇨🇴🇳🇿
- Tweets549
- Following559
- Followers366
- Likes2.2K






ALT fig.1 from the paper showing the relationship between control and realism in conservation physiology


ALT Wordart with the word 'Abstract' in various languages, including French, Greek, Chinese and Hawaiian


ALT Fig 1. (a.) Sampling site location (b.) Experimental design (c.) Temperature profiles and sampling time points in the heat stress assay, demonstrating the ramp up from control conditions (27 ºC, MMM) to target heated treatments 33 ºC, 34 ºC, and 35 ºC. Sampling time points are indicated with dashed vertical lines: "T1" represents the end of the heating hold and "T2" represents the end of the recovery period. A single replicate tank of each temperature treatment (containing 10 colony fragments) was sampled at both T1 and T2.

ALT Fig 2. (a.) Density plot of PC1 values for transcriptome-wide gene expression of Acropora cf. tenuis. 6 hours into (T1) short-term heat stress. Colours represent the bleaching (34 ºC) and sub-bleaching (33 ºC) temperature treatments and the controls. Differentially expressed genes (DEGs) between treatment and controls are shown. (b.) Boxplot of red channel intensity for heat stress temperature treatments (control, 33 ℃, 34 ℃ and 35 ℃) taken 16 h post heat stress and averaged across n = 10 Acropora cf. tenuis. colonies. P-values are provided for the significant pairwise comparisons, control and 34 ºC and control and 35 ºC – see supplementary File 1: Table S1. (c.) Bar plot of top enriched gene ontology terms for comparisons of heat stress treatments 6 hours into the experimental stress; 33 ºC (sub-bleaching), 34 ºC (bleaching) compared to controls and 33 ºC directly with 34 ºC (color-coded). All terms were enriched with a maximum FDR-adjusted p-value of 0.05.

ALT Fig 3. a Density plot of PC1 values for transcriptome-wide gene expression of Acropora cf. tenuis. 6 h into (T1) short-term heat stress. Colours represent the bleaching (34 ℃) and sub-bleaching (33 ℃) temperature treatments and the controls. Differentially expressed genes (DEGs) between treatment and controls are shown. b Boxplot of red channel intensity for heat stress temperature treatments (control, 33 ℃, 34 ℃, and 35 ℃) taken 16 h post heat stress and averaged across n = 10 Acropora cf. tenuis colonies. p-values are provided for the significant pairwise comparisons, control and 34 ℃ and control and 35 ℃—see supplementary File 1: Table S1. c Bar plot of top enriched gene ontology terms for comparisons of heat stress treatments 6 h into the experimental stress; 33 ℃ (sub-bleaching), 34 ℃ (bleaching) compared to controls, and 33 ℃ directly with 34 ℃ (colour-coded). All terms were enriched with a maximum FDR-adjusted p-value of 0.05


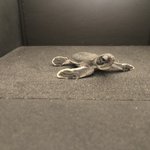
ALT Scientists collecting baby green sea turtles for a project.

ALT Scientists collecting baby green sea turtles for a project.

ALT Scientists collecting baby green sea turtles for a project.

ALT Scientists collecting baby green sea turtles for a project.


ALT https://www.uni-goettingen.de/en/644546.html?filters={%22vollzeit%22:[],%22befristet%22:[],%22gruppe%22:[],%22besoldGrp%22:[]}&details=75938


ALT The trophic network of temperate reef fishes in Rottnest Island

ALT Gemini generated