

Your go-to resource for all things decarbonization in the utilities industry. Follow us to be a part of the decarbonization conversation!
Joined May 2021
- Tweets347
- Following1.1K
- Followers312
- Likes62




Pinned Tweet
Our Fall 2025 Utility Decarbonization Report is packed with insights, from #CleanEnergy gains to methane tracking and capital efficiency.
• Methane scoring: 80x more potent than CO₂
• 18M tons CO₂ = 4M cars off the road
📘 Download the report: decarbonizationreport.com
One U.S. utility reports near-zero emissions intensity. See how the other 46 compare:
f.mtr.cool/v8b6o8y6zz

4 of 47 major U.S. utilities have no net-zero target.
See the full 2026 Magic Radar:
f.mtr.cool/kjbtdng0f4

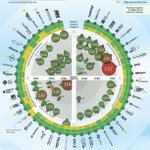
NEW: The 2026 NPUC Magic Radar. 47 investor-owned utilities compared on emissions intensity, net-zero targets, and Scope 3 reporting.
f.mtr.cool/hcedrsd75t

Tomorrow, we open the doors.
The NPUC #UtilitySolutionsForum starts tomorrow, September 22, at #TheNestCampus, North Javits Center. Two half-days of candid, peer-level conversation among utility leaders, co-hosted with Motive Power.
See you there.
#ClimateWeekNYC

U.S. electricity prices: up ~30% since 2020.
Some states +72%. Others -18%. Full map 👇
f.mtr.cool/17ghdjui38
#Electricity #Utilities #EnergyAffordability #CleanEnergy #EnergyTransition

Electricity costs are up ~30% since 2020. Affordability is becoming a defining challenge for utilities and ratepayers.
Full state-by-state map 👇
f.mtr.cool/g87pbwe16p
#Electricity #Utilities #EnergyAffordability #GridModernization #EnergyTransition

Two half-days, two focuses.
Day 1: Powering the AI and data center boom
Day 2: Built to last, a reliable, resilient, and affordable energy future.
Real working sessions with the people navigating these decisions right now.
See the full agenda: decarbforum.com

2 weeks to go until the NPUC Utility Solutions Forum, co-hosted with @MotivePower5 at The Nest Campus.
September 22-23 in New York, during Climate Week. Utility attendance is complimentary.
Register here: web.cvent.com/event/0748e54c…
#ClimateWeekNYC #TheNestCampus

Coastal markets: prices up 50%+
Interior states: flat or declining.
The electricity price divide is real. Full map 👇
f.mtr.cool/4kyofh2g8c
#Electricity #Utilities #EnergyAffordability #GridModernization

DC: +72%. North Dakota: -18%.
Americans are paying ~30% more for electricity than in 2020. We mapped every state 👇
f.mtr.cool/yn9cdzvtft
#Electricity #Utilities #EnergyAffordability #GridModernization

Utility leaders, two half-days, one room. The NPUC Utility Solutions Forum returns Sept 22–23 in NYC during Climate Week. Grid modernization, electrification, AI-driven load growth.
Learn more: web.cvent.com/event/0748e54c…
#ClimateWeekNYC #TheNestCampus
The Energy and Tech Stage at @ResetConnect London covers grid flexibility, decarbonisation strategy, and progress and pace.
We have the U.S. utility data behind all three.
Free report: f.mtr.cool/orzmgjsled
#LondonClimateWeek #NPUC


In case you missed it: U.S. carbon offsets by project type in 2026.
4% carbon capture. 12 projects. Utilities need a broader playbook.
Full infographic: f.mtr.cool/yfksjyfigd
#Utilities #CarbonOffsets #Decarbonization

Only 10 of 46 U.S. IOUs include all Scope 1, 2, and 3 in their net-zero targets. The accountability gap is a grid flexibility gap.
We're bringing this data to @ResetConnect London.
#LondonClimateWeek #NPUC

91% of U.S. carbon credits come from 4 project types. Carbon capture is not one of them.
Full market breakdown: f.mtr.cool/ottwxxubbj
#Utilities #CarbonOffsets #NetZero

U.S. utility emissions intensity dropped 7%+ since our last report. But 58% of IOU generation is still fossil fuel. Progress is real. Accountability isn't keeping pace.
Full data: f.mtr.cool/ljbqvmyfvx
#UtilityData #LondonClimateWeek
Denise Owusu is speaking at @ResetConnect London on grid flexibility — representing NPUC on the Energy and Tech Stage.
Free tickets available! DM us.
#LondonClimateWeek #NPUC

IOUs may need a broader playbook. The offset market still leans on nature-based projects. Carbon capture is 4%.
How utilities can act now: f.mtr.cool/krjjzgxtoz
#Utilities #CarbonCapture #EnergyTransition
573M carbon credits. 7 project types. Carbon capture: 4%.
The offset market and net-zero goals are not aligned yet.
Full breakdown: f.mtr.cool/iksjkgendo
#Utilities #CarbonOffsets #NetZero

In case you missed it: we mapped which states are most prepared for power demand surges.
Florida leads with 3,003 MW. Rhode Island and Wyoming report zero capacity. The gap is growing.
Full map: f.mtr.cool/eiuzynrvgk #GridResilience #DemandResponse
