

Ride the big waves 🌊 | Master the cycle Macro analysis | Higher timeframes | Trade less, earn more. BTC & Altcoins
No financial advice
Joined August 2022
- Tweets3.9K
- Following349
- Followers6.1K
- Likes8.2K






Pinned Tweet
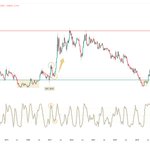
$OTHERS/BTC (1M) – This is massive. 👀
Back in March, I said two things had preceded the last major altseasons:
→ OTHERS/BTC breaks out
→ Squeeze Momentum turns green
The breakout already happened.
And now we’re seeing the first green momentum bar forming since 2022.
Only 4 days left until the monthly candle closes.
Look at the previous times this happened.
2017 → altcoins exploded.
2021 → altcoins exploded.
After 4 years of Bitcoin dominance, the same conditions are starting to line up again.
You might not be ready for what comes next. 🌊


OTHERS/BTC (1M) - The signal that started the last 2 altseasons is forming again.
Zoom out.
Every major altcoin expansion started the same way:
🔹OTHERS/BTC breaks out of a falling wedge
🔹Squeeze Momentum turns green
When those two align, altcoins start massively outperforming Bitcoin.
2017 🚀
2021 🚀
But this cycle was different.
After the 2021 peak, the Squeeze Momentum stayed red for years.
That meant:
🔹Prolonged Bitcoin dominance
🔹No real altseason
Now something interesting is happening.
OTHERS/BTC just broke out of another multi-year falling wedge.
And momentum is rising again.
If the Squeeze Momentum flips green, the same conditions that triggered previous altseasons could return.
And when that happens…
The biggest moves usually start when nobody expects them.

$BTC (1D) – Breakout. 👀
BTC held the $81–82K support area once again.
Stoch RSI is crossing bullish and price has now broken out of the short-term pattern.
That’s exactly what I wanted to see.
Next stop: $87K.
Break that and $93–95K is back on the table.
Until $87K breaks, we’re still inside the bigger range.

$ETH/BTC (1W) - I’ve seen this before. 👀
Back in 2021, ETH/BTC broke its downtrend, pushed higher, then momentum cooled all the way back down.
Once Stoch RSI crossed bullish again ETH took off against Bitcoin.
Now we’re seeing a very similar story play out.
Same support area.
Same downtrend break.
Same momentum reset.
If that next bullish cross shows up again, things could get interesting very fast. 🌊

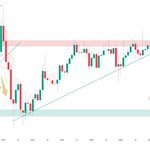
$OTHERS/BTC (1M) – Breakout + retest
If you zoom out and focus on the bigger picture, it’s much easier to stay calm during a pullback.
The multi-year downtrend is broken.
Now OTHERS/BTC is coming back to retest that breakout.
This is exactly the kind of structure you want to see before altcoins start outperforming Bitcoin in a big way.
If this retest holds, the next wave could be the biggest we’ve seen since 2021. 🌊

$BTC.D + $ETH.D + Stablecoins (1M) – The rotation is coming. 👀
This chart combines BTC dominance, ETH dominance and stablecoin dominance.
Basically, it shows how much of the market is still concentrated in Bitcoin, Ethereum and cash.
When this falls, capital is rotating into the rest of the altcoin market.
The uptrend broke in September and many alts pumped.
Now we’re retesting that breakdown right below the 80–82% resistance zone.
On the higher timeframe, this is exactly what I want to see.
Short term is different.
If BTC struggles, alts can easily stall with it.
But once Bitcoin finds its footing and starts pushing higher again, I think that’s when the real rotation into alts kicks in.
Zoom out. Be patient.
The biggest altcoin wave in years is coming. 🌊

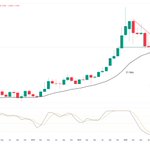
$SILVER – Back in.
Earlier this year I took profits around $94 after the huge run.
Since then, silver has cooled off hard and is now back at monthly support + the 21M SMA.
Stoch RSI is fully reset too.
So I bought some again here with a stop around $53.
Back then I was protecting profits.
Now I like the risk/reward again.

Silver (2M) – Pay attention
I normally focus on crypto here, but this is worth mentioning.
The 2-month RSI is at a level we’ve only seen twice in the last 50 years.
1980 and 2011.
Both marked a major local top.
Could Silver still push higher?
Absolutely. Markets can overshoot.
But on a multi-decade timeframe, risk/reward is no longer attractive to me.
I’m not here to catch the last 10–20%.
This is my signal to fully exit Silver.
No greed. I’m very happy with the profits.

$BTC (1D) – Buyers are defending $82K.
BTC dipped below $80K and got bought up fast.
That long wick tells you buyers are still there.
Now price is compressing again just above support.
Break out of this pattern → I think BTC fires higher.
Lose this support → the bigger cooldown starts.
This level decides the next move.

$SPX (2M) – Is another blow-off top coming? 👀
Back in May, I pointed out the 10+ year RSI downtrend.
That downtrend is now broken and RSI is already pushing toward 84.
Why does that matter?
Look at the last 100 years.
Every time the 2M RSI broke above this area, the S&P entered a major blow-off phase.
This only happened 4 times before:
1927-1929
1954-1956
1986-1987
1995-2000
Now we’re getting close again.
If RSI pushes through 84 and momentum keeps expanding, history says things can get very aggressive from here.
And if equities enter another true euphoria phase…
crypto will feel it too.
More liquidity. More risk appetite. More speculation.
You ready? 🌊
Inspiration: @CryptoCrewU

$INJ (2D) – GOLDEN CROSS
I first shared INJ when it was sitting at the bottom of the channel around $2.80 back in March.
It’s now trading around $8.
And INJ just printed a golden cross.
This signal is rare.
It only happened once before.
After the cross INJ saw more than 1,000% upside.
Is history about to repeat?🌊

$USDT.D (1W) – Support did its job.
I said before that if this level held, crypto would probably cool off for a bit.
That’s exactly what happened.
Now Stoch RSI is starting to turn back up from the lows.
So I wouldn’t be surprised to see some more pressure on crypto short term.
But the bigger rotation story hasn’t changed.
Once USDT.D loses 6%, it’s game on. 🌊

$USDT.D (1W) – The 2022 setup played out. 👀
Back in July, I pointed out the same bearish divergence that marked the 2022 top in USDT dominance.
Same resistance.
Same higher high in dominance.
Same lower high on RSI.
Since then, USDT.D has broken its uptrend and dropped straight back toward support.
Capital rotated back into crypto and many altcoins exploded.
Now watch this support closely.
Lose it → more fuel for crypto.
Hold it → expect a cooldown.

🚨 Wave Report #27 just dropped
Three weeks ago, I warned about the bearish divergence on BTC and a possible move back toward $82K.
That move came in the days after.
Now Bitcoin is sitting at another important decision point.
The monthly still looks strong, but lower-timeframe momentum is starting to cool.
And there’s one path that could still send BTC toward $95K before the bigger reset.
In this week’s report, I break down the full picture across 4 timeframes.
Read THE WAVE REPORT 👇
newsletter.crypflowacademy.c…
Subscribe if you want the next one in your inbox.

CRYPFLOW retweeted
With the 1W and 2W Stoch RSI both in the high-momentum zone, a bearish crossdown is very likely in the coming month. Whether we push higher first remains uncertain, but I still expect a higher low to form once momentum cools off. That's the moment to add to your position to have the best risk/reward.
$BTC (1D) – Power of Three?
BTC spent days moving sideways.
Then price suddenly dropped below the range, making it look like a breakdown.
But instead of continuing lower, BTC quickly moved back inside.
We saw the same kind of deviation in September.
After that, BTC rallied towards $87K.
This is what's called a Power of Three setup:
Range → fake move lower → expansion higher.
If this is happening again, the next move should be up.
Break $87K and I’m looking towards $93–95K.

$BTC (1D) – Two paths from here.
BTC dipped below the range and now needs to get back above it.
That makes this pretty simple.
Reclaim the range → deviation again and another push higher.
Get rejected here → I expect a deeper correction.
RSI is in the same spot, trying to recover after losing its uptrend.
This reclaim matters.

$BTC (2W) – Another confirmation forming.
21 WMA back above the 21 SMA = bull market confirmation.
We’ve seen it after every major cycle bottom.
And now it’s happening again.
The ribbon is turning green.
If you’re still waiting for new cycle lows, I’d let that idea go.

$BTC (2W) - This is when the bull market gets confirmed.
This crossover has consistently separated bull markets from bear markets:
→ 21 WMA crossing above the 21 SMA = bull market
→ 21 WMA crossing below the 21 SMA = bear market
You can see it clearly across every cycle:
2014 → bear market confirmation
2015 → bull market confirmation
2018 → bear market confirmation
2019 → bull market confirmation
2020 → crash alert
2020 → Bull market continues
2022 → bear market confirmation
2023 → bull market confirmation
2025 → bear market confirmation
BTC is currently pushing into the ribbon again.
But for now, price is still getting rejected at the 21 WMA.
That’s the level bulls need to reclaim first.
When this crossover flips bullish again,
it will be the confirmation you were waiting for.
Bookmark this 👊

$ONDO (1W) – Breakout + retest.
Back in September, $0.44 was the level that mattered.
ONDO reclaimed it, broke the multi-year downtrend, pushed towards $0.60 and then came back for the perfect retest.
It got bought up quickly.
Exactly what you want to see before the next move higher.

ethereum:0xfaba6f8e4a5e8ab82f62fe7c39859fa577269be3 (1W) – Looks ready👀
The multi-year downtrend is already breaking.
RSI has broken out.
Momentum is strong.
Now there’s only one thing standing in the way:
$0.44 resistance.
Reclaim that level and ONDO is ready for its next wave.

$FET/BTC (1W) – It’s happening. 👀
Back in September, I said there wasn’t much room left.
Support held and both price and RSI broke out.
Now both are coming back to retest those broken downtrends as support.
If they hold, expansion is next.

$FETBTC (1W) – Getting very close. 👀
This is starting to look a lot like the previous cycle.
Back then, FET spent months squeezed between support and the long-term downtrend before finally breaking out and massively outperforming BTC.
Now we're basically back in the same spot.
Support is holding, the downtrend is sitting right above price and the weekly Stoch RSI just crossed bullish from oversold.
There really isn’t much room left.
Break that downtrend and things could move fast. 🌊

$INJ/BTC (1W) – Looks very strong. 👀
The multi-year downtrend is broken.
The retest held.
And now INJ is reclaiming the key level against Bitcoin.
Look at the previous cycle.
Same breakout.
Same retest.
Then expansion.
Hold this reclaim and I think INJ starts another major run against BTC. 🌊

celestia:native (1W) – Waking up.
First shared this setup back in March.
Since then, TIA built a strong base at the lows and broke out of the descending channel.
Now price is back around $0.60.
Expansion looks close. 🌊
Who’s in?

$TIA (1W) - High risk/high reward
Price compression.
RSI compression.
Stoch RSI bullish cross.
Momentum is resetting across the board.
Two levels need to break for the next expansion:
🔹Price downtrend
🔹RSI downtrend
If both break, expansion could be next with a possible target of $2.
Setup is getting interesting.
NFA

$BTC (1W) – This is the level bulls needs to defend
BTC got rejected at R1 ($87K) and fell below S1 ($82.5K).
But for now, price is trying to hold this area as support.
On the weekly, this is the zone I want to see defended.
RSI is currently retesting the multi-year downtrend it recently broke.
That retest needs to hold too.
If price loses this area and RSI falls back below the breakout, then the recent move starts looking more like a deviation.
Stoch RSI is also trying to cross bearish, but as long as both lines stay above 80, that signal isn’t confirmed yet.
For now, bulls still have control. But this is the area they need to defend.

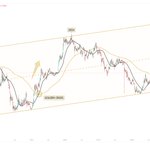
$OTHERS (1M) – This is where it gets interesting. 👀
Altcoins failed to break the 2021 top and got sent all the way back towards the bottom of this 9-year channel.
Now they’re breaking the multi-year downtrend that started in 2024.
And look at what happened every time a long-term downtrend broke before:
The bottom was in.
If you had patience, the upside was massive.
The next big level is obvious:
The 2021 and 2024 top.
Break that and OTHERS has room to move through the entire channel.
A lot of people will look at the top of this chart and call those numbers impossible.
But once a real bull market starts and euphoria kicks in, “impossible” levels suddenly get reached very fast.
Short term dips are noise, focus on the the bigger picture and take advantage of those opportunities🌊

$BTC (1D) – Two paths from here.
BTC dipped below the range and now needs to get back above it.
That makes this pretty simple.
Reclaim the range → deviation again and another push higher.
Get rejected here → I expect a deeper correction.
RSI is in the same spot, trying to recover after losing its uptrend.
This reclaim matters.