





Elect retweeted

Miyamoto Musashi spent his life mastering the sword.
He fought his battles. Defeated his opponents. Became a legend.
And towards the end of his life?
He chose solitude. Art. Writing. Peace.
Think about that for a second.
A man who spent his entire life becoming one of the greatest warriors in history eventually understood that there was something more valuable than winning.
Peace of mind.
And I think that’s a lesson many ambitious people miss.
You don’t spend your life becoming powerful just to keep fighting forever.
You do it to become free.
To wake up one day, put the sword down, and simply enjoy being alive.
Because what is the point of conquering the world if you cannot find peace within yourself?

Elect retweeted
BTC/SPX
youtube.com/live/8WjOUaFeTGk…


Elect retweeted
THE ECOSYSTEM INSIDE A RANGE V9
A range is not just a high and a low. When a range is large enough, it can contain an entire ecosystem of price action inside.
Multiple smaller ranges. Internal market structure. Accumulations and distributions. Liquidity sweeps, expansions, retracements, and transitions from one phase to another.
All developing inside one higher-timeframe range.
A HTF range can become the environment in which countless smaller structures form. Each lower-timeframe range has its own boundaries, liquidity, equilibrium, and orderflow. One range can break into another. An accumulation can transition into a distribution the second it taps TT
This is why you should never look at a range as a single, static formation.
Zoom in, and you begin to see the internal structure. Zoom out, and you understand how those smaller formations fit into the larger picture.
The key is learning to connect them.
Where is price positioned within the HTF range?
What phase is developing on the MTF?
Which side holds the relevant liquidity?
Is the internal structure supporting continuation toward the HTF boundary, or is the orderflow changing?
The same principles repeat across timeframes, but context determines how you interpret them.
Backtest the range from February 26 to November 6, 2024.
Study the entire range from the HTF down to the LTF. Identify the smaller ranges that formed inside it, their internal structure, the accumulations and distributions, the liquidity taken, and how each phase transitioned into the next.
Don't just mark the obvious highs and lows. Reconstruct the sequence. Understand how each smaller structure developed within the larger environment and how price moved between them.
The objective is to see the ecosystem, not just the range.
Once you learn to recognize the smaller structures inside a larger one, the chart stops looking like random sideways movement. You begin to see how individual phases connect, how liquidity guides price between levels, and how the same structural principles repeat at different scales.
Understanding what a range is will only take you so far. The real edge comes from understanding how ranges behave, how they interact with each other, and what their internal structure tells you about the market's next potential move.
Advanced range theory allows you to stop seeing a range as a simple high and low and start reading it as a complete market environment.
But these formations do not exist in isolation. Their location, sequence, and relationship with the higher-timeframe range determine their significance.
A lower-timeframe accumulation at the discount of a major HTF range carries different context than the same formation directly beneath significant HTF supply or right on the EQ. The pattern may look identical, but the surrounding conditions are not.
This is why advanced range theory matters.
You need to understand how ranges form, how they develop, how they fail, and how price transitions between them.
You also need to understand that a range can contain conflicting information. The HTF may remain bullish while the MTF develops bearish structure. That bearish movement could be a normal internal retracement, or it could be the beginning of a larger transition. The surrounding liquidity, location, and subsequent structural behavior help you distinguish between the two.
Advanced range rules provide a framework for interpreting these situations instead of reacting to every movement as an isolated setup.
The more accurately you can read the ecosystem inside a range, the better you can identify meaningful opportunities, recognize invalidation earlier, and avoid forcing trades where the conditions do not support your idea.
Study ranges beyond their boundaries. Study their internal phases, their transitions, their failures, and their relationship with the larger market structure.
Because the range you see on your chart may only be one layer of a much larger structure.


HOW TO MASTER RANGES V8
If you want to master ranges, you need to stop looking at them as simple sideways price action.
A range is a structure of its own. It's an environment where liquidity is constantly being created, orders are being absorbed, and price is building the conditions for its next expansion.
Your job is to understand how that process develops, how to map it, and what information price gives you before it leaves the range.
Start by studying the ranges.
Go through your charts and find every major range you can identify. Study the initial range high and range low, how they are formed, how price reacts around them, and how the structure develops between those extremes.
Don't just draw a box around sideways price action.
Understand what price is doing inside it.
Where is liquidity accumulating?
Which side is being defended?
Where is price accepting or rejecting?
Is the range expanding, compressing, or preparing for a potential breakout?
What does the orderflow suggest about which side gets taken first?
These are the questions you should be asking.
Learn how to map your ranges correctly in relation to the underlying market structure. Understand the direction of the broader trend, identify the relevant swing points, and use them to establish your range boundaries.
Then study equilibrium.
The 50% level of a range divides it into premium and discount. Learn how price behaves above and below this level, how it reacts when returning to equilibrium, and whether the structure supports continuation towards the opposite extreme.
But don't treat equilibrium as a magical line.
Being in discount doesn't automatically mean price should go up, just as being in premium doesn't automatically mean price should go down.
Location gives you context. Structure and orderflow tell you what price is doing with that context.
Study the moments when equilibrium holds, when price crosses it without resistance, and when a return to equilibrium becomes the starting point for another expansion.
Then go deeper.
Study how ranges form inside other ranges.
Your HTF range establishes the broader context. Your MTF range helps you understand how price is moving within that context, while your LTF structure allows you to refine your execution.
Learn to recognize when these structures align and when they conflict.
For example, when an LTF Wyckoff schematic forms at the extreme discount of an MTF range, inside a relevant HTF demand zone, you have multiple layers of context supporting the same idea 1/2

Elect retweeted
The greatest tragedy is not failing to become extraordinary. It's reaching the end of your life never knowing what you could have become if you had given it everything.


Elect retweeted
HOW TO MASTER LIQUIDITY V6
If you want to master liquidity, you need to stop looking at it as something you simply mark on a chart.
You need to understand how it's created, how it's consumed, how price reacts around it, and how it influences the path towards the next target.
The best way to learn this is through repetition.
Go through your charts and find every Wyckoff range you can identify.
Study the liquidity inside the range.
Where are the equal highs and lows?
Where is the extreme liquidity?
Where is price building liquidity internally?
Which side gets taken first, and what did the structure tell you before it happened?
Don't just mark the sweep and move on.
Study what happened before the sweep, how price approached the liquidity, how it reacted after taking it, and whether the expected orderflow developed.
Study the return to zone in every PO3 you can find.
Understand what a good return to zone looks like, why some returns lead to strong expansions, and why others fail completely.
Study how price behaves when it returns to a zone after taking liquidity.
Does the structure confirm your expectation?
Does price show signs of absorption?
Does the LTF begin shifting in the expected direction?
Does the return create another opportunity to hunt liquidity on the opposite side?
You need to understand the difference between price simply touching a zone and price returning to a zone with a clear purpose.
Then study the extreme liquidity inside ranges.
Understand how price behaves when it approaches the range highs or lows, what happens when that liquidity gets swept, and what happens when price fails to reach it.
Sometimes the market takes the extreme liquidity and reverses.
Sometimes it sweeps the liquidity, returns into the range, and continues towards the opposite side.
Sometimes it builds so much opposing orderflow that the expected move never happens.
Your job is to understand why. 1/2


LIQUIDITY V5
Liquidity is one of the most important concepts in trading.
Liquidity is what allows the market to move.
Without liquidity, you can't fill large positions efficiently. The bigger the position you want to build, the more liquidity you need on the other side of your order.
This is why liquidity matters so much.
When you trade enough size, the volume of the instrument you're trading becomes extremely important. You can't expect to market order a large position into a low-volume coin without causing significant slippage or moving the market against yourself.
Large participants need liquidity.
They need people willing to take the other side of their orders.
This is where the concept becomes interesting.
A large player doesn't simply decide to buy a massive position and click market buy.
There needs to be enough opposing liquidity for those orders to be filled.
This is why the market constantly creates, attracts and consumes liquidity.
Stops sitting above highs.
Stops sitting below lows.
Breakout traders entering positions.
Traders closing positions.
Limit orders sitting at important levels.
Market orders triggered by those levels.
All of this creates liquidity.
When you understand this, you stop looking at a high or low as simply a line on your chart.
Where is the liquidity?
Who is likely trapped here?
Who is likely to enter if this level breaks?
Who is forced to exit if this level breaks?
How much liquidity is available?
And most importantly
What does price need to do to access it?
Liquidity is not simply "where the stops are."
It's the available opposing orderflow that allows positions to be entered and exited.
This is why liquidity and structure should always be studied together.
You can see equal highs sitting above price, but that doesn't automatically mean price must take them.
You need to understand the structure, the location, the expected orderflow and the path price has created toward that liquidity.
One of the most important things to understand is the difference between a low-resistance liquidity run and a hard-resistance liquidity run.
A low-resistance liquidity run is when price moves toward a target while continuously mitigating or consuming the opposing liquidity along the way.
Price is essentially creating a good return to zone while moving toward its objective.
This creates a low-resistance roadmap.
And when price finally wants to move through that area, there is very little standing in its way.
This is why these moves can be extremely fast.
You can see price run through an area with almost no pullback, because the market has already done the work beforehand.
The liquidity has been created.
The opposing zones have been mitigated.
The path has been prepared.
Then the expansion happens.
In a hard-resistance run, price is still moving toward the target, but there is significantly more opposing orderflow along the way.
You can see multiple legs.
Reaccumulation.
Redistribution.
Ranges.
Liquidity sweeps.
Pullbacks.
More liquidity being created.
Price is still moving toward the objective, but the roadmap is much harder.
Expected orderflow tells you what you expect the market to do next.
Liquidity gives you the potential destination.
Put them together and you have a much clearer view.
The important thing is understanding whether the expected sequence is still developing.
The goal isn't to predict exactly which liquidity pool gets taken next.
The goal is to understand the conditions surrounding it.
Where is the liquidity?
How was it created?
How much resistance exists between price and the target?
What structure is controlling the move?
What is the expected orderflow?
What happens if the liquidity is taken?
What happens if it isn't?
Once you start asking these questions, your charts become much clearer.


Elect retweeted
BUNKER MODE. 🧩
64 bytes.
Decades of trust built on mathematical assumptions.
But every narrative has two sides.
Fear is one of the most powerful catalysts for change.
What if the perceived threat becomes the justification for an entirely new financial infrastructure?
Bitcoin was never just about price.
Perhaps the greatest Trojan horse in financial history was the introduction of digital money itself.
First, you introduce the technology.
Then, you challenge the security.
Eventually, you redefine the entire system.
The question isn’t just what could break.
It’s what gets built next.
Connect the dots.
Something is cooking.


Elect retweeted
⚔️ THE COST OF NEVER FINDING OUT
You can spend your entire life believing you are capable of something exceptional, provided you never put that belief to the test.
That is a comfortable place to hide.
The business you could build. The skill you could master. The person you could become if you ever “really tried.”
As long as it stays hypothetical, your potential remains untouched. Nobody can question the results because there are none.
Then you commit.
Suddenly, there is a gap between who you thought you were and what you can actually do. Closing that gap takes longer than you expected. Your weaknesses become visible, sometimes to the very people you wanted to impress.
Can you keep working through that?
Can you be a beginner at something you want to become exceptional at? Can you admit your approach was wrong without abandoning the ambition?
That is where the pursuit starts costing you something.
An extraordinary ambition comes with the possibility of falling short. You have to decide whether it matters enough to pursue without a guarantee.
I want to find out what I am capable of while I still have the time to do something about it.
Even if the answer humbles me. At least then I have something real to work with.
“I could have” is a fucking expensive sentence to grow old with.
Elect retweeted
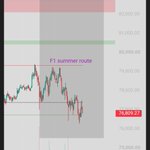
Quick update: my base case stays bullish into Singapore F1. A bearish shift remains a low probability scenario.
Uptober caught on fast. Too many heavy longs, and we may need a liquidation flush first. With the quarterly close, hedge fund positioning and put and call expiries in the mix, volatility shouldn’t surprise anyone.
The PO3 lookalike was valid to scale around, but I’m not heavily hedging my main longs yet. If redistribution develops and price confirms it, I’ll reassess.
Can we flip the script? Yes. Will I update you? Absolutely. Is that my base case? No.
Don’t confuse a calendar narrative with confirmation. Early validation of Uptober could still draw the crowd into a trap.
Stay focused. Let price action speak.
We don’t predict. We react.

Elect retweeted
$BNB is heating up again.
Show me your charts.
BNB Chain is super hot right now.
$BNB.D
Mark out the two supply zones on your chart.
The inducement market maker supply zone is the key one expect some reversals there.
The main reversal should happen inside the market maker supply zone.
We’re trading against a six-month Bojan low super strong.
It’s a textbook setup.
Yes, you can make serious money right now on BNB chain.
But don’t fall into shiny-object syndrome.
The answer is always mid-timeframe Wyckoff.
If you see a clean mid-time Wyckoff structure even on a low cap you can trade it.
Just use good risk management.
Last time it was Solana.
Everyone got lost in the trenches.
Look how that ended.
Don’t get obsessed with what’s pumping right now.
The real money is in:
• learning how to trade
• proper risk management
• stacking % gains over and over again
• precise execution
You can execute on these coins, sure
but if you’re not disciplined, you’ll lose everything.
Maybe you make money once…
then go heavier next time…
make more… go even heavier…
and then lose it all.
That’s the cycle.
Dopamine-triggered coin, coin, coin? No.
Mid-timeframe Wyckoff.
If you’re disciplined, go ahead and execute.
If not just watch and learn.
Next cycle, after you’ve studied how it all works…
you’ll know exactly how to act when euphoria returns

