

Drill Down Visuals for #PowerBI and JavaScript Charts Library for #DataExploration
- Tweets1.3K
- Following2.6K
- Followers1.5K
- Likes3K




ALT ZoomCharts promotional graphic for “8 Best Power BI E-Commerce Dashboards 2027,” featuring a dark-themed Power BI e-commerce profitability dashboard with sales KPIs, revenue trends, product profitability, and promotion performance charts.

ALT Dark navy ZoomCharts graphic announcing two open Power BI challenges: “AI Agents & Customer Support,” with a November 16 deadline, and “Recruitment Dashboard,” with a November 25 deadline. A green button reads “Swipe to explore.”


ALT Change indicator setup guide in Drill Down Donut PRO visual for Power BI


ALT Series Labels display the series name next to the chart and connect the label to the matching line or area series.

ALT Promotional graphic for the FP20 Analytics & ZoomCharts Challenge 41, featuring 25 Power BI dashboards focused on PMO Project Portfolio Data Analytics. The purple background displays ZoomCharts and FP20 logos above overlapping dashboard previews showcasing project performance, portfolio health, delivery risks, KPIs, and interactive data visualizations.


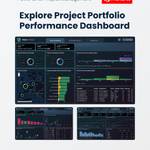
ALT Project Portfolio Performance Dashboard – Power BI project management report with portfolio health, financials, project locations, priorities and performance insights.

ALT Portfolio Health Dashboard – Power BI view showing project health by business unit, location, priority, complexity and portfolio category.

ALT Project Value Dashboard – Power BI report comparing planned and actual project costs with forecast and realized benefits.

ALT Project Deep Dive Dashboard – Power BI view tracking individual project progress, costs, benefits, risks and performance against plan.