

The most powerful and intuitive #datavisualisation technology for Microsoft's #PowerBI, #Excel, and #PowerPoint!
Ljubljana, Slovenia
Joined January 2014
- Tweets4.3K
- Following850
- Followers5.3K
- Likes2.6K





"Within seconds, we can pinpoint where we're losing. Within minutes we know what to do." — Robert Anschütz, Ipsen Pharma.
Read the full story below ⬇️
#ZebraBI #CustomerWins

ALT Zebra BI_Ipsen Pharma_Customer story
Ipsen Pharma story: eu1.hubs.ly/H0yVTNP0

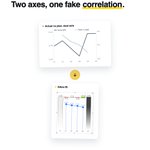
Left: Microsoft's sample report. Right: the same page, rebuilt by an AI agent in #ClaudeCode with #ZebraBI visuals.
Same data. Which one tells you faster where you stand?
On 27 October, we'll show how it was done, step by step, and what's new in #Fabric.
📅 Tuesday, 27 October · 6 pm CET / 1 pm EDT / 10 am PDT
👉 Save your seat: eu1.hubs.ly/H0z01tV0


"With Zebra BI, we created a Board of Directors dashboard giving leadership direct access to the most critical financial data." Kees Leenders, Heijmans.
Read how in the comments. ⤵️
#ZebraBI #PowerBI #CustomerWins

ALT Zebra BI_Heijmans_Customer story

One chart, the whole sales funnel: volume and drop-off at every stage, segment by segment.
Download in the comments. 👇
#ZebraBI #PowerBITemplates

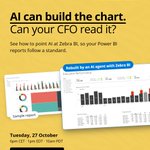
AI can build the chart. Can your CFO read it?
On Oct 27, watch an AI agent rebuild a #PowerBI report with Zebra BI visuals, and see what Zebra AI adds in #MicrosoftFabric. 👉 bit.ly/4huNHK5
Free live webinar, with Q&A.
📅 6pm CET / 1pm EDT / 10am PDT


"Who here uses Zebra BI?"
Andrej asked that on stage at #FabConEurope in Barcelona. Almost every hand in the room went up. 🙌
Thanks to everyone who stopped by booth 56 to see Tables+ and Charts+ and try the new AI agent that builds Power BI reports with Zebra BI.
See you at FabCon 2027! #PowerBI

Grand totals on Excel bar charts shouldn't need helper rows and invisible series.
Here's what it looks like done right.
Full video: eu1.hubs.ly/H0ykFGM0
#ZebraBI #DataAnalytics


W.L. Gore story: eu1.hubs.ly/H0y7_dh0


Consolidated financials are where Power BI reports usually get messy.
This template keeps entities side by side with variances calculated automatically.
Download it ⤵️
#ZebraBI #PowerBI #PowerBITemplates

"If you've seen one Zebra BI report, you can navigate the rest, whether you're a controller or in the C-suite."
Stephanie Husser, Helvetia Switzerland. ⤵️
eu1.hubs.ly/H0y1rB80
#ZebraBI #CustomerWins

ALT Zebra BI_Helvetia_Customer story
A cost report sorted A to Z looks thorough, but the overruns stay buried between Advertising and Utilities.
Put the variance on every line and they light up in red instead.
#PowerBI #ZebraBI #FinancialReporting

ALT Zebra BI_variance