

Macro research for investors. Covering Asia, commodities, currencies, and asset allocation. Sign up for free daily Newsletter: https://xitter.cf/t.co/C4EG0o3TVg
Joined March 2024
- Tweets1.2K
- Following161
- Followers1.7K
- Likes107



CHINA'S IMPORT BOOM EXPOSES ITS BIGGEST TECHNOLOGICAL VULNERABILITY
China's September 2026 imports surged 31.0% year over year.
But the composition tells a far more revealing story.
Automatic data-processing equipment imports: +296.5%.
Integrated circuits: +74.7%.
Iron and steel products: approximately +46%.
Unwrought copper products: approximately +40%.
Natural gas: +34.0%.
Copper ores and concentrates: +27.1%.
Together, data-processing equipment, integrated circuits, and copper ores contributed 22.6 percentage points—approximately 73% of China's total import growth.
Meanwhile, automobile imports contracted roughly 25%, automotive parts fell approximately 35%, and large aircraft imports plunged more than 50%.
YCC Capital's conclusion is clear:
China's import recovery is being driven disproportionately by technology infrastructure and industrial inputs—not broad consumer demand.
Despite massive investments in technological self-sufficiency, China's dependence on imported advanced components remains substantial.
The AI boom is boosting China's trade statistics while exposing its strategic dependencies.

TWO PRODUCT CATEGORIES ARE CARRYING CHINA'S EXPORT BOOM—AND THAT'S A MAJOR WARNING
China's September 2026 exports surged 36.3% year over year.
But YCC Capital's contribution analysis reveals extraordinary concentration.
Integrated circuits contributed approximately 7.9 percentage points to total export growth.
Automatic data-processing equipment added another 5.0 percentage points.
Combined contribution: nearly 13 percentage points—approximately 36% of China's entire export expansion.
Automobiles contributed another 2.5 percentage points, while refined oil products added approximately 1.3 points.
Here's the critical detail:
Semiconductor export prices surged 133.7%, while shipment quantities increased just 1%.
China's semiconductor export boom is overwhelmingly a pricing phenomenon, not a volume revolution.
That creates substantial downside exposure if the global chip-pricing cycle reverses.
YCC Capital's conclusion: China's headline export strength is increasingly dependent on a narrow, potentially unstable set of growth drivers.

CHINA'S EXPORT WINNERS ARE SURGING—BUT THE GROWTH IS DANGEROUSLY UNEVEN
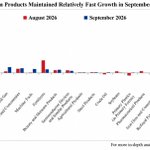
September 2026 delivered extraordinary growth across China's manufacturing exports:
Integrated circuits: +136.0%
Refined oil products: approximately +124%
Data-processing equipment: +92.9%
Automobiles: +62.0%
Wood products: approximately +47%
Toys: +40.8%
Household appliances: approximately +31%
Automotive parts: +24.3%
Clothing: +23.8%
Furniture: +22.0%
But not every sector participated.
Fertilizer exports collapsed approximately 60%, while ceramic products declined nearly 20%.
Even smartphone exports grew only 14.2%, despite sharply higher average selling prices.
YCC Capital identifies a troubling pattern: China's export expansion is increasingly concentrated in AI-related electronics, selected industrial products, and automobiles.
These industries are vulnerable to pricing reversals, trade barriers, and global investment cycles.
China's manufacturers can produce enormous quantities.
The harder question is whether they can sustain pricing power and profitability when external conditions deteriorate.

CHINA'S TRADE SURGE LOOKS SPECTACULAR—UNTIL YOU EXAMINE WHAT'S DRIVING IT
China's September 2026 trade figures delivered a dramatic acceleration:
Exports: +36.3% YoY, versus approximately +25% in August.
Imports: +31.0% YoY, accelerating further from August.
Monthly exports reached a record $447.18 billion, while imports totaled $313.65 billion.
The result? A staggering $133.53 billion merchandise trade surplus in a single month.
During January–September, China's exports increased 21.3%, approaching $3.4 trillion.
Yet YCC Capital sees a critical vulnerability.
Much of this acceleration reflects AI infrastructure investment, semiconductor price inflation, and favorable comparison effects—not a broad domestic recovery.
China's export machine is thriving while its underlying economic model remains increasingly dependent on external demand.
For investors, the distinction is crucial.
Record trade volumes do not automatically translate into stronger corporate profitability, household consumption, or sustainable economic growth.

CHINA'S EXPORT BOOM IS EXPLODING—BUT FOREIGN DEMAND IS MASKING DOMESTIC WEAKNESS
China's September 2026 export growth across major markets was extraordinary:
🇹🇼 Taiwan: +68.5%
🇰🇷 South Korea: +68.2%
ASEAN: +52.3%
Russia: +51.1%
India: +47.5%
🇺🇸 United States: +39.6%
🇦🇺 Australia: +37%
🇨🇦 Canada: +31%
🇬🇧 United Kingdom: +28%
🇪🇺 European Union: +25.3%
But the real story isn't China's economic strength.
South Korea's surge is heavily driven by AI-related shipments, while America's rebound partly reflects favorable comparisons following 2025 tariff disruptions.
China is increasingly dependent on foreign technology investment and overseas consumers to absorb its industrial output.
YCC Capital's assessment: Strong exports are concealing structural vulnerabilities in China's domestic economy.
The greater China's dependence on external demand, the more exposed its manufacturers become to semiconductor cycles, trade restrictions, and geopolitical shocks.
Export growth is not economic resilience.

🚨 U.S. INFLATION COULD REACH 5% AGAIN — THE MATHEMATICS ARE UNCOMFORTABLE.
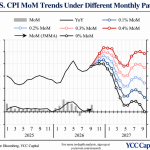
YCC Capital's inflation scenario analysis reveals how sensitive America's CPI outlook has become to monthly price increases.
If CPI rises 0.4% every month, annual inflation could exceed 5% around early 2027 and remain near 4.8% by September.
At 0.3% monthly inflation, the annual rate could approach 5% before moderating toward 3.7%.
Even a sustained 0.2% monthly pace could leave inflation around 2.4% by September 2027.
Only a 0.1% monthly trajectory brings inflation meaningfully closer to the Federal Reserve's 2% objective.
The danger is straightforward.
Elevated oil prices, resilient demand, and broadening services inflation make sustained monthly price stability increasingly difficult.
YCC Capital's conclusion: the U.S. inflation outlook is highly asymmetric. Small monthly upside surprises can produce major annual inflation consequences — and force markets to reprice monetary policy.

🚨 U.S. INFLATION EXPECTATIONS HAVE BEEN REPRICED DRAMATICALLY HIGHER.
Markets are no longer treating America's inflation problem as temporary.
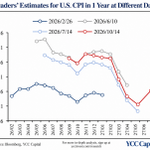
In February 2026, traders expected U.S. CPI inflation one year ahead to remain around 2.3%–2.9%.
By June, several forward inflation estimates had surged above 4%.
The latest October 14 pricing shows expectations near 3.9% for November 2026, approximately 3.7%–3.8% through early 2027, and around 2.6% by July 2027.
That's a dramatic upward repricing from February.
The market now anticipates a prolonged period of elevated inflation before meaningful normalization.
YCC Capital believes persistent oil prices, resilient consumer demand, and renewed goods inflation are driving this shift.
The implication is significant: higher inflation expectations threaten Treasury duration, reduce the Fed's easing flexibility, and increase the risk of renewed volatility across U.S. equities and bonds.

U.S. SERVICES INFLATION IS RUNNING TOO HOT FOR COMFORT.
September's supercore inflation data reveal why the Federal Reserve cannot declare victory.
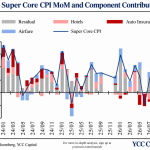
The broader supercore measure increased 0.42% MoM, slowing from August's 0.51%.
That looks encouraging until you examine the underlying trend.
The three-month annualized rate reached approximately 4.48%.
September's 0.42% monthly increase alone translates into roughly 5.2% annualized inflation if sustained.
The component breakdown reveals persistent contributions from underlying services, even as hotels, airfares, and auto insurance generate volatile monthly swings.
In early 2026, monthly supercore inflation approached 0.6% before briefly turning negative around midyear.
The latest rebound demonstrates how quickly momentum can return.
YCC Capital believes persistent U.S. services inflation leaves the Fed with limited room to ease without risking another inflationary resurgence.

🚨 U.S. SUPERCORE INFLATION IS STUCK ABOVE 3% — THE FED'S PROBLEM ISN'T SOLVED.
America's most persistent services inflation remains uncomfortably elevated.
Supercore CPI surged toward 7% YoY in 2022–2023 before retreating as pandemic distortions faded.
But the latest readings remain around 3%–4%, substantially above pre-pandemic norms.
The composition is particularly revealing.
Hotels, airfares, and auto insurance have contributed significantly to historical volatility, but the residual services component now accounts for much of the remaining inflation.
That means the problem extends beyond a handful of easily reversible price shocks.
September's broader supercore measure increased 0.42% MoM, while its three-month annualized rate reached approximately 4.48%.
YCC Capital sees persistent underlying services pricing power despite moderation in selected categories.
The Fed can look through temporary airfare swings. It cannot easily ignore inflation embedded across the broader U.S. services economy.

🚨 AMERICA'S RENT INFLATION IS REFUSING TO NORMALIZE.
The U.S. rental market is sending mixed signals to the Federal Reserve.
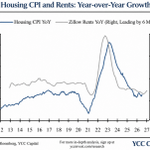
Zillow's rent inflation surged toward 16% YoY during the pandemic, leading official housing CPI by approximately six months.
Shelter inflation subsequently peaked above 8% in 2023.
Both measures then declined sharply.
But the latest data suggest the disinflation process is becoming increasingly fragile.
Official housing CPI remains around 3.3% YoY, while Zillow rent growth has stabilized near 3%–4% and recently edged higher.
September shelter CPI accelerated to 0.39% MoM from 0.26%.
Rent inflation reached 0.25%, while owners' equivalent rent increased 0.35%.
YCC Capital believes the historical rental disinflation tailwind is weakening.
If market rents stop declining and energy costs remain elevated, housing could become a persistent obstacle to Federal Reserve rate cuts.

AMERICA'S HOUSING INFLATION HAS A 16-MONTH WARNING SIGNAL.
U.S. shelter inflation remains one of the biggest obstacles to sustainable disinflation.
YCC Capital's historical analysis shows that home-price growth tends to lead housing CPI by approximately 16 months.
The relationship captured major turning points.
During the pandemic housing boom, annual home-price inflation exceeded 20%, followed by shelter CPI accelerating above 8% in 2023.
Both have since cooled dramatically.
Today, home-price growth is near 2%–3%, while housing CPI remains around 3%.
That suggests additional shelter disinflation remains possible.
But September delivered a warning.
Shelter CPI accelerated to 0.39% MoM from 0.26%, while owners' equivalent rent increased 0.35%.
YCC Capital's conclusion: favorable housing leading indicators do not guarantee smooth disinflation. Sticky shelter costs could keep U.S. core inflation elevated longer than investors expect.

🚨 GLOBAL SUPPLY CHAINS ARE THREATENING U.S. DISINFLATION AGAIN.
The relationship between global supply-chain stress and American goods inflation is becoming increasingly important.
During the pandemic, the Global Supply Chain Pressure Index surged above 4, while U.S. core-goods inflation excluding used cars approached 8% YoY.
Both subsequently collapsed as logistics conditions normalized.
Now the relationship is turning again.
Supply-chain pressures have rebounded into positive territory, while U.S. core-goods inflation excluding used cars has recovered toward 1%–2%.
September core-goods prices accelerated 0.25% MoM, their strongest increase since February 2025.
Tariffs, transportation costs, and technology-related demand are creating additional pressure.
YCC Capital believes the disinflationary dividend from global supply-chain normalization is fading.
For markets, renewed goods inflation threatens Treasury valuations, corporate margins, and expectations of Federal Reserve easing.

U.S. USED-CAR INFLATION IS FLASHING A WARNING — THE OLD PLAYBOOK IS BREAKING.
Used vehicles are becoming an important source of renewed American goods inflation.
September used-car prices contributed approximately 9.6 basis points to monthly core-goods inflation.
But the bigger development is the growing divergence between retail CPI and wholesale vehicle prices.
Historically, the Manheim Used Vehicle Value Index leads official used-car CPI by roughly two months.
The latest readings show retail used-car inflation moving back above 1% YoY while the corresponding wholesale indicator remains near zero or slightly negative.
That disconnect matters.
Wholesale price weakness is no longer translating reliably into consumer-level disinflation.
Retail margins, inventory conditions, and pricing behavior may be disrupting historical relationships.
YCC Capital sees a clear forecasting risk: investors relying on yesterday's leading indicators may underestimate tomorrow's U.S. inflation.

🚨 U.S. INFLATION IS SPREADING — THIS IS THE FED'S BIGGEST WARNING SIGNAL.
America's inflation problem is no longer confined to a few volatile categories.
YCC Capital's inflation-breadth analysis reveals a sharp deterioration.
The share of CPI components recording annualized monthly inflation above 4% jumped from 20% to 35%.
Meanwhile, the share exceeding their five-year historical averages climbed from 17.6% to 24.76%.
That's a 15-percentage-point surge in high-inflation categories.
During the 2022 inflation shock, more than 70% of components exceeded 4% inflation.
Today's breadth remains substantially lower, but the latest reversal is significant.
Broadening inflation suggests businesses across multiple industries are regaining pricing power.
This makes monetary easing increasingly difficult.
YCC Capital's conclusion: the danger isn't another isolated inflation spike. It's the gradual rebuilding of economy-wide inflation momentum.

🚨 WALL STREET UNDERESTIMATED U.S. INFLATION AGAIN.
September core CPI delivered another uncomfortable surprise.
Actual inflation: +0.33% MoM.
Consensus forecast: +0.20%.
That's a 13-basis-point upside miss, with actual inflation running 65% above expectations.
The broader pattern matters.
Throughout much of 2025, analysts repeatedly anchored monthly core CPI expectations around 0.3%, even as actual readings fluctuated substantially.
In 2026, forecasts shifted toward 0.2%, reflecting growing confidence in disinflation.
September challenged that confidence.
A sustained 0.33% monthly pace compounds to approximately 4% annual inflation, double the Federal Reserve's 2% target.
YCC Capital sees a growing risk that consensus forecasts are underestimating persistent demand, housing costs, and energy-related price transmission.
The biggest risk for markets isn't high inflation alone. It's inflation repeatedly exceeding what investors have already priced in.

AMERICA'S INFLATION VICTORY IS REVERSING — AND THE WARNING IS IN CORE CPI.
U.S. core inflation has fallen dramatically from its 2022 peak, but the latest data suggest the final stage of disinflation is becoming increasingly difficult.
Core CPI accelerated to 2.56% YoY in September, up from 2.45% in August.
Housing inflation remains above 3%, while core services excluding housing are also running near 3%.
The most concerning development is core goods.
After collapsing from approximately 12% inflation in 2022 into outright deflation, goods prices have returned to positive annual growth.
That removes an important offset to persistent services inflation.
YCC Capital believes the U.S. inflation problem is shifting from concentrated post-pandemic distortions toward broader pricing pressures.
Getting inflation from 6% to 3% was achievable. Getting sustainably below 2% may require significantly tighter financial conditions.

🚨 U.S. CORE INFLATION IS REACCELERATING — THE FED HAS A PROBLEM.
America's disinflation story is losing momentum.
September core CPI rose 0.33% MoM, exceeding the 0.2% consensus and accelerating from August's 0.29%.
The three-month annualized trend reveals the bigger problem: underlying inflation is turning higher again.
Core services excluding housing are running near 4.4% annualized, while housing inflation remains stubbornly above 3%.
Core goods, previously a major disinflationary force, are also rebounding.
This is a dangerous combination.
When goods, housing, and services accelerate simultaneously, the Federal Reserve cannot dismiss inflation as an isolated shock.
YCC Capital sees an increasingly uncomfortable trade-off: resilient American demand is sustaining pricing power precisely when elevated energy costs threaten another inflationary impulse.
The market is pricing disinflation. The data are increasingly challenging that assumption.

Europe Is Building a Trade Wall Against China’s Industrial Overcapacity.
The EU’s response to Chinese manufacturing expansion is becoming broader, tougher, and increasingly structural.
Chinese electric vehicles already face additional EU countervailing duties of 7.8%–35.3%, on top of the standard 10% tariff.
In 2026, Europe expanded trade defenses across multiple industries.
Steel import arrangements cut the annual duty-free quota to 18.3 million tonnes, approximately 47% below 2024 levels, with above-quota tariffs reaching 50%.
Chinese solar products, aluminum-related materials, tires, and industrial chemicals also face intensified scrutiny.
Meanwhile, the removal of the exemption for parcels below €150 introduces additional costs for Chinese cross-border e-commerce.
YCC Capital sees a decisive shift.
China’s strategy of exporting excess industrial capacity is colliding with Europe’s determination to preserve domestic manufacturing.
The era of unrestricted Chinese export expansion is ending.

China’s Manufacturing Dominance Conceals a Critical Technological Dependence.
China’s imports from the EU reveal where its industrial capabilities remain vulnerable.
In 2016, passenger vehicles dominated Chinese imports from Europe at $16.89 billion, representing 8.9% of the total.
By 2025, integrated circuits had taken the top position at $17.01 billion, followed by organic chemicals at $15.13 billion and semiconductor-manufacturing equipment at $13.14 billion.
Passenger-vehicle imports fell to $10.53 billion, just 3.9% of the total.
Meanwhile, semiconductor equipment represented 4.9% of Chinese imports from Europe, and vaccines and related immunological products reached $8.78 billion.
The shift is revealing.
China is increasingly replacing European consumer-facing industrial products while continuing to purchase advanced technologies it cannot easily replicate.
YCC Capital believes this exposes a fundamental weakness: China’s downstream manufacturing strength does not equal technological independence.
Europe’s greatest advantage remains scarce intellectual property and specialized industrial expertise.

China’s Export Transformation Is Creating a Direct Threat to European Manufacturing.
In 2016, China’s largest exports to the EU were mobile phones at $25.58 billion and data-processing equipment at $22.97 billion.
By 2025, the export mix had fundamentally changed.
Data-processing equipment reached $32.08 billion, batteries $30.36 billion, mobile phones $29.05 billion, cross-border e-commerce parcels $27.26 billion, and passenger vehicles $19.11 billion.
Batteries now represent 5.4% of Chinese exports to Europe, up approximately 5 percentage points since 2016.
Passenger vehicles account for 3.4%, an increase of 3.3 percentage points.
This is no longer simply a consumer-electronics trade relationship.
China is exporting directly into Europe’s strategic industrial sectors.
YCC Capital sees the danger: subsidized capacity and aggressive pricing can capture market share, but they also destroy margins and accelerate protectionist responses.
Export growth is not the same as sustainable profitability.
