

Data-driven long-range weather forecast analytics built for energy meteorologists since 2009.
State College, PA
Joined January 2018
- Tweets2.6K
- Following943
- Followers10K
- Likes13.6K





Pinned Tweet
A note on what's changing here.
@WorldClimateSvc is becoming a channel for World Climate Service product-based analysis, updates, and commentary
Prescient Weather co-founder and previous author Richard James is now posting at @rjameswx - same weather and climate posts, new home
It's starting to look more likely that El Niño may not achieve the peak Niño3.4 SST anomaly predicted by the seasonal models in the past couple of months.
Still a long way to go, however. And there will be little or no practical difference in global weather/climate impacts.


Which climate index has the strongest relationship with ERCOT winter HDDs?
Using World Climate Service data, we analyzed 35 climate indices against ERCOT population-weighted heating degree day (HDD) anomalies over 45 winters (1981–82 through 2025–26).
The results: ABNA and EPO have the strongest historical correlations with winter HDDs.
• ABNA: r = -0.40
• EPO: r = -0.38 (p = 0.01)
• Both ranked among the top five indices across all four winter periods analyzed.
Lower ABNA and EPO values have historically been associated with higher ERCOT HDDs.
What about El Niño?
• Niño 3.4 ranked 27th of 35 indices (r = +0.07, p = 0.65).
• Of the six strongest El Niño winters, four had below-normal HDDs and two had above-normal HDDs.
• HDD anomalies ranged from 14% below normal to 37% above normal.
These results do not rule out an ENSO influence on ERCOT winter weather. However, EPO and ABNA have shown substantially stronger historical relationships with winter HDDs.
Even the strongest correlation explains only approximately 16% of winter-to-winter HDD variability. These relationships provide historical context, not a forecast.
Which ISO and climate index combination should we analyze next? Let us know in the comments.
#EnergyMeteorology #EnergyTrading #ERCOT #NaturalGas #WeatherRisk #ABNA #EPO #ENSO


Analyze weather and climate data objectively with the World Climate Service. Sign up for a free trial here: bit.ly/wcs-free-trial-twitte…
What happens when Google WxNext3 assigns a substantially higher probability to a European weather regime than other forecast models?
Today's World Climate Service analysis highlights a significant difference in the 11–15 day Euro-Atlantic weather regime forecasts from ECMWF, AIFS ENS, WxNext3, GEFS, and CMC.
Through the medium range, the models show relatively consistent weather regime probabilities. However, WxNext3 diverges considerably in the 11–15 day period.
On October 24, WxNext3 assigns a 77% probability of Scandinavian Blocking, compared with 47% from ECMWF, 39% from AIFS ENS, 29% from GEFS, and 24% from CMC.
WxNext3 maintains a relatively high probability of Scandinavian Blocking through October 28, although it declines to 52%.
What does this mean for energy meteorologists on power and natural gas trading desks?
The WxNext3 ensemble members associated with Scandinavian Blocking indicate warmer-than-normal temperatures across much of Europe and below-normal wind speeds.
This scenario would suggest:
• Reduced heating demand relative to normal temperatures.
• Below-normal wind power generation potential.
• Different weather-related risks for natural gas demand and power markets.
Using the World Climate Service Grams seven-regime forecasts, energy meteorologists can quantify differences in regime probabilities across models, identify the circulation scenarios driving those differences, and evaluate their associated temperature and wind risks.
Rather than relying solely on ensemble mean forecasts, weather regime analysis provides additional information about the range of potential weather outcomes and where forecast models disagree.
The World Climate Service helps energy meteorologists amplify their meteorological expertise.
#EnergyMeteorology #WeatherRegimes #WeatherRisk #EnergyTrading #WeatherForecasting

Analyze the risks embedded in Google WxNext3's ensemble mean:
bit.ly/wcs-free-trial-regime…
World Climate Service will be at Energy Trading Week Americas 2026 with a booth focused on the weather decisions that matter to energy meteorologists on power and natural gas trading desks.
WCS is built for energy meteorologists who need to turn forecast uncertainty into risk intelligence their traders can use. Rather than relying on a single forecast outcome, WCS helps meteorologists evaluate the range and probability of weather scenarios across medium-range, subseasonal, and seasonal time scales.
If you support a power or natural gas trading desk, stop by the World Climate Service booth on October 27-28 to meet the team and discuss how you approach long-range weather risk.
Schedule a meeting with Kevin Stenson here: info.prescientweather.com/me…
#EnergyTradingWeek #EnergyTrading #EnergyMeteorology #WeatherRisk

Schedule a meeting with Kevin Stenson here: info.prescientweather.com/me…
The ensemble mean can hide forecast scenarios with materially different impacts.
Weather regime analysis helps energy meteorologists identify alternative scenarios, assess their probabilities, and examine associated weather outcomes.
Today's World Climate Service (WCS) forecast provides an example using Google's new WxNext3 model.
The attached graphics compare North American weather regime forecasts from:
• Top: Multi-model ensemble blend (ECMWF, GEFS, CMC, AIFS ENS, and WxNext3).
• Bottom: WxNext3 alone.
What happens when we isolate ensemble members associated with the Greenland High regime?
For October 23, the WxNext3 regime-matched ensemble subset forecasts precipitation anomalies exceeding +3 standard deviations across parts of North Texas. The multi-model blend also shows above-normal precipitation, but with a less pronounced anomaly.
Interestingly, WxNext3 assigns a lower probability to the Greenland High regime than the multi-model blend, despite forecasting a more extreme precipitation anomaly within that scenario.
For power and natural gas trading desks, this illustrates how regime probabilities and regime-matched ensemble forecasts provide additional information about potential weather outcomes and forecast uncertainty.
Today's update also marks the WCS transition from Google's WxNext2 to WxNext3 model in its weather regime analysis.
The World Climate Service helps energy meteorologists amplify their meteorological expertise.
#EnergyMeteorology #WeatherRisk #EnergyTrading #WeatherRegimes

If Google's WxNext3 ensemble mean is a powerful tool, imagine how powerful WxNext3 regimes can be. Try it here:
bit.ly/wcs-free-trial-regime…
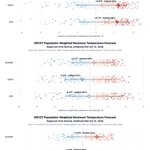
How do the latest ERCOT population-weighted maximum temperature forecasts compare with historical model forecasts?
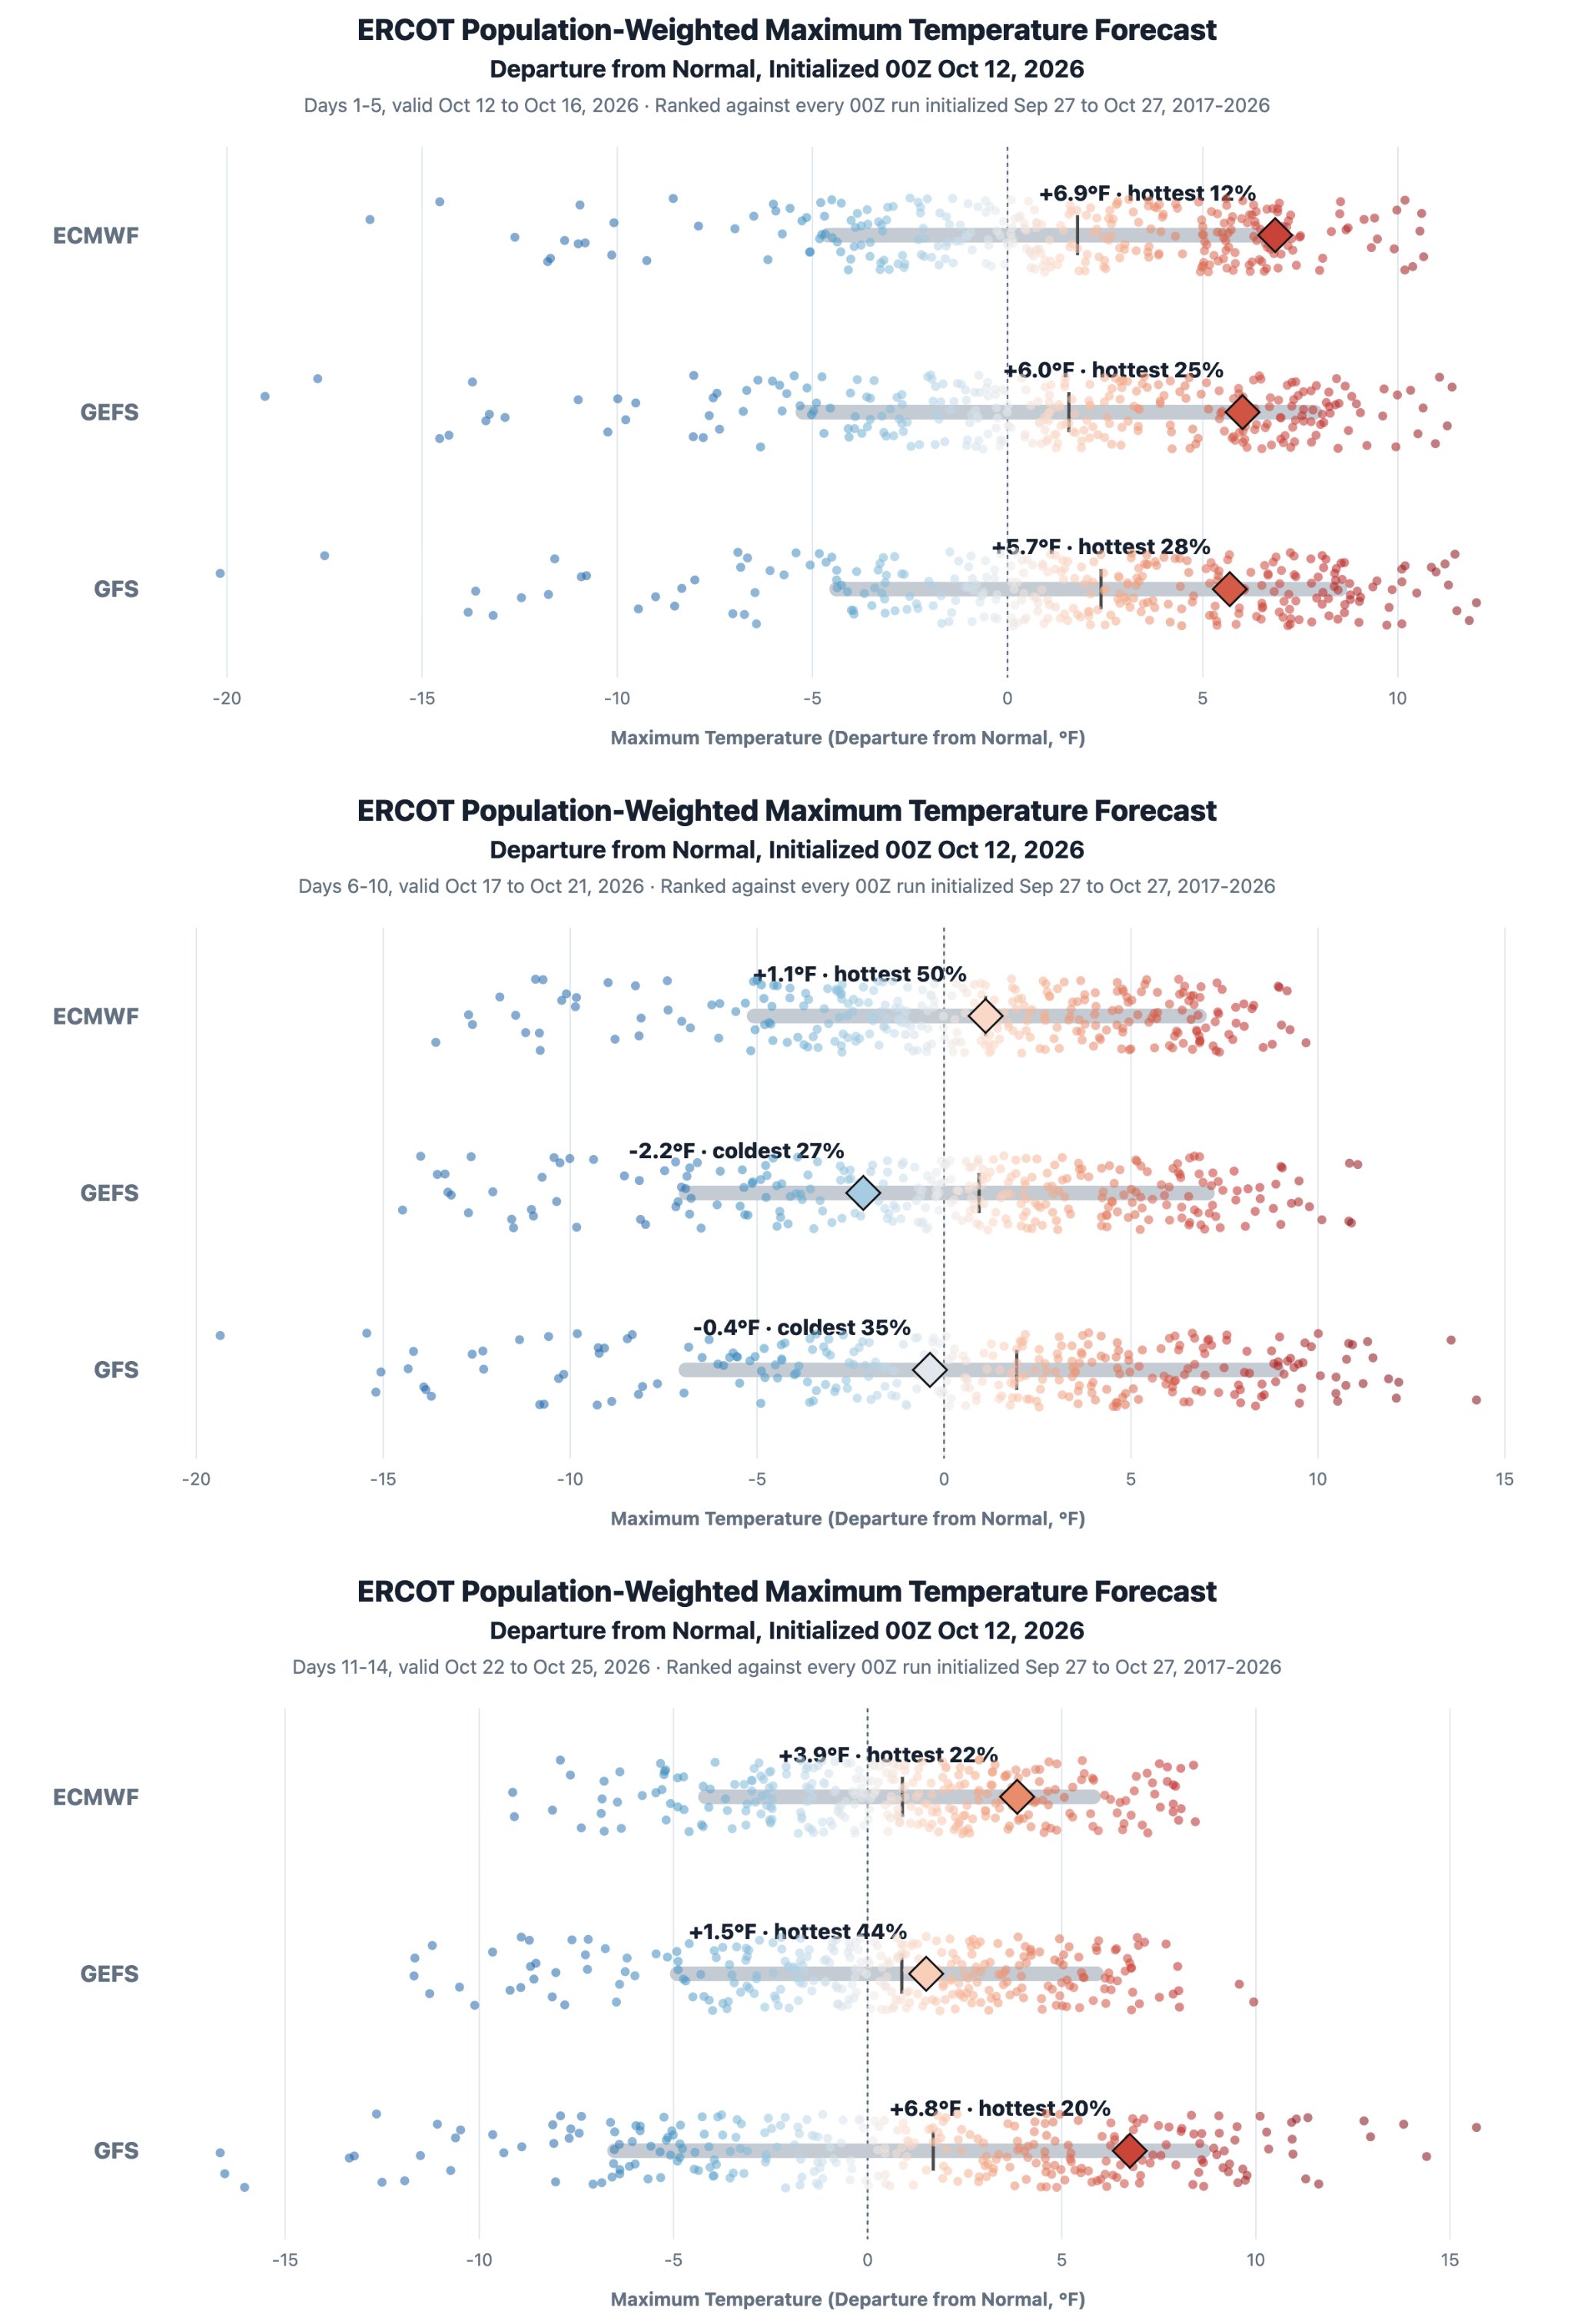
The ECMWF, GEFS, and GFS forecasts show above-normal temperatures in Days 1-5, greater model differences in Days 6-10, and a return to above-normal temperatures in Days 11-14.
Using more than 8 years of archived forecasts from the World Climate Service Point-in-Time Weather Forecast API, we compared the current ERCOT population-weighted maximum temperature anomalies with historical forecasts initialized within ±15 calendar days of October 12 for the same forecast lead times.
Days 1-5: Above-normal temperatures
ECMWF: +6.9°F | Hottest 12%
GEFS: +6.0°F | Hottest 25%
GFS: +5.7°F | Hottest 28%
Days 6-10: Greater differences between models
ECMWF: +1.1°F | Hottest 50%
GEFS: −2.2°F | Coldest 27%
GFS: −0.4°F | Coldest 35%
Days 11-14: Above-normal temperatures
ECMWF: +3.9°F | Hottest 22%
GEFS: +1.5°F | Hottest 44%
GFS: +6.8°F | Hottest 20%
The largest differences between models occur in Days 6-10, when the ECMWF forecasts slightly above-normal maximum temperatures while the GEFS and GFS forecast below-normal temperatures.
By Days 11-14, all three models forecast above-normal temperatures again, with the GFS showing the largest positive anomaly.
For power and natural gas trading desks, the historical rankings provide additional context for evaluating how unusual the current ERCOT temperature forecasts are relative to each model's historical forecast distribution.
#ERCOT #ECMWF #GEFS #EnergyTrading #NatGas #PowerMarkets

Get a risk-free trial of the WCS here:
bit.ly/wcs-free-trial-twitte…
Regime probabilities can provide additional context for what is contributing to changes in the ensemble mean.
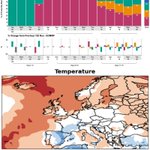
In today’s ECMWF forecast, Blocking probabilities increase during parts of the 11–15 day period. Blocking members favor warmer conditions across northern Europe and near-normal temperatures across much of central Europe.
At the same time, the ECMWF ensemble mean remains broadly warm across northern and eastern Europe, while the 24-hour change shifts cooler across central Europe.
For power and natural gas desks, regime analysis provides additional information on the scenarios and probability changes behind the ensemble mean.
#EnergyWeather #PowerMarkets #NaturalGas #ECMWF #WeatherRegimes


Get a risk-free trial of the regime tool: bit.ly/wcs-free-trial-regime…
Power trading profits can be substantial when an energy meteorologist brings unique insight to the trading desk about the likelihood of an upcoming extreme event.
Those unique insights can come from the same data everyone has, but require rigorous meteorological science, historical data, and analytical effort.
The World Climate Service creates opportunities for energy meteorologists to generate those unique insights that drive trading profits.
Today’s 00Z ECMWF Extended weather regime forecast shows how this works just beyond the medium range.
The forecast transitions through several Euro Atlantic regimes before uncertainty increases substantially in the subseasonal period.
Regime probabilities are helpful, but they become more valuable when paired with a historical analysis of regime impacts.
We combined two long meteorological histories to investigate that relationship. The process is:
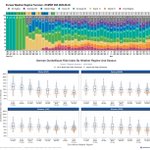
1) We used nine years of historical forecasts from the World Climate Service Point in Time Weather Forecast Archive API to establish a climatology from ECMWF IFS 51 member capacity-weighted wind and solar forecasts for Germany.
2) From that forecast climatology, we developed a Dunkelflaute Risk Index, or DRI, defining an event when the combined wind and solar forecast falls below the 20th percentile. Those events are the orange dots in the graphic.
3) We then combined the DRI history with our archive of observed Grams seven regime classifications to understand how Dunkelflaute risk varies by weather regime.
The result provides a valuable way to interpret a subseasonal regime forecast.
The risks and opportunities embedded in the ensemble means everyone else is using can then be translated into differentiated risk intelligence for power and gas trading desks by connecting the probabilities of Atlantic Ridge, Scandinavian Blocking, European Blocking, or another circulation pattern with the likelihood of Dunkelflaute events embedded in each forecasted flow regime.
This does not remove the considerable uncertainty at subseasonal lead times, nor does a regime forecast determine whether a Dunkelflaute will occur.
It provides an additional layer of risk information just beyond the medium range, when the details of an individual weather scenario become increasingly uncertain, but the probabilities of large-scale circulation patterns can still provide useful information about upcoming weather risks.
That is where an energy meteorologist can add value. The forecast data are available to the market.
The meteorological science used to extract, combine, and communicate the embedded power market risk creates the differentiated insight. The World Climate Service helps energy meteorologists amplify their meteorological expertise.
#EnergyMeteorology #Dunkelflaute #WeatherRisk #EnergyTrading #SubseasonalForecasting

See how weather regime forecasts can amplify your meteorological expertise: bit.ly/wcs-free-trial-regime…
This morning's #CAISO pop weighted 14-day accumulated CDD forecast is the highest CDD forecast this time of year in the prior nine years of ECMWF IFS, GEFS, and GFS forecasts.
Each dot represents one forecast sampled from the prior nine years of 14-day CDD forecasts in the Point-in-Time Weather Forecast Archive API.
That's nine years of ECMWF, GEFS, and GFS forecasts available for power market analysis for US ISOs.

World Climate Service retweeted

The latest CanSIPS seasonal forecast holds steady with its peak Niño3.4 SST forecast.
Still need another full degree C of Niño3.4 warming to meet this expectation. Given subsurface warmth, it's certainly possible, although surface warming has lagged recently.


Weather regimes help energy meteorologists uncover the forecast risks hidden by the ensemble mean. They show which alternative weather scenarios could materially change a power trading desk's perception of weather forecast risks.
Today’s 00Z ECMWF Extended weather regime forecast provides a good example for MISO renewable power.
The Pacific Trough is the predominant North American regime forecast through much of October, with substantial probabilities extending into the subseasonal timeframe.
Why does that matter? Our analysis of 2,645 days of observed North American regimes and MISO renewable power capacity utilization provides the historical context that frames the risks embedded in the forecast.
During SON, the Pacific Trough is associated with the lowest median renewable capacity utilization of the four Lee regimes.
Median utilization under the Pacific Trough is 79% of the median under the Pacific Ridge, the regime associated with the highest median utilization during SON.
The forecast still contains considerable uncertainty, as the regime probabilities imply.
But the power market analysis enables the meteorologist to translate the forecast into actionable risk information they can communicate with their desks.
Interpretation of the ensemble mean alone cannot highlight forecast risks.
Regime forecasts provide the scenarios and their probabilities. Historical regime impact analysis provides the renewable power context.
The energy meteorologist translates the forecast uncertainty into actionable power market risk information.
#EnergyMeteorology #RenewableEnergy #WeatherRisk #EnergyTrading #SubseasonalForecasting

Get a risk-free trial of the World Climate Service here: bit.ly/TryWCSTwitter