

Director, Evidence & Insight @LR_Foundation World Risk Poll - Ex @WhatWorksWB @PolicyProfUK - Trustee @TheNCCH Leadership Fellow @StGeorgesHouse FRSA SaintsFC
- Tweets29.7K
- Following7.1K
- Followers6.3K
- Likes48.1K






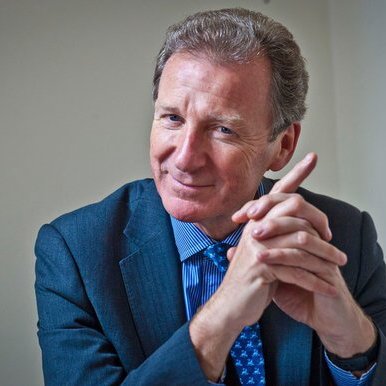
ALT A photo of Nancy Hey and a quote from her blog "While the Centre will no longer lead the field, the importance of its mission remains: to secure a future where the wellbeing of people and communities in the UK improves year-on-year and wellbeing inequalities are reduced."


ALT Map presented under the title “Change of Life Satisfaction in the UK, 2012-2023”. Subtitle reads: “Some areas of the UK have seen substantial increases in average life satisfaction over the past decade - but others have lagged behind.” Local authority areas in England, Scotland and Wales are coloured in various shades of red and green, with green shades to represent areas with an increase in average life satisfaction between 2012 and 2023, and red shades to indicate a decrease. Darker shades represent a larger change. Grey regions denote places for which there is no data or insufficient sample size. The source of the graph is the Annual Population Survey, presented in the 2025 UK Wellbeing Report published by the World Wellbeing Movement, of which a full citation is provided.


ALT An image of the #BeeWell logo and text that reads '#BeeWell schools receive their 2024 survey feedback this week!' and the slogan 'Making young people's wellbeing everybody's business'.


ALT Text extract from the UKRI website which reads: Transforming global evidence: AI-driven evidence synthesis for policymaking Apply for funding to develop and administer a global evidence synthesis infrastructure. This infrastructure will significantly increase capability in researcher and AI-driven evidence synthesis for policymaking. You must be based at a UK research organisation eligible for ESRC funding. Opportunity status: Open Funders: Economic and Social Research Council (ESRC) Funding type: Other Total fund: £11,500,000 Publication date: 19 September 2024 Opening date: 19 September 2024 9:00am UK time Closing date: 12 December 2024 4:00pm UK time


ALT A graph depicting female life expectancy at birth over the years, with the vertical axis representing lifespan in years, and the horizontal axis indicating years from 1840 to 2023. Various colored dots represent different countries, with Hong Kong with the highest in 2023 at 88.1 years. The graph notes that Hong Kong and Japan have held records for the past 40 years. Previously, countries like Iceland, Norway, Australia, and Sweden were among the highest. Data sources are the Human Mortality Database for 2024 and UN World Population Prospects for 2024.


ALT Mayor of West Yorkshire, Tracy Brabin, holding a booklet that says "Cultures of Creative Health" on the front. She is stood in front of a large blue map of West Yorkshire.


ALT The Three Bricklayers story, or 3 Bricklayers Parable, is about the meaning, vision, leadership, and motivation of work.


ALT Image showing new features to download data from charts on Our World in Data.



ALT Graphic showing that 48% of children remained active over the last two years. The chart compares activity levels from pre-pandemic at 47%, 45% during 2020-21 restrictions, and 48% in the 2023-24 academic year. Source: Sport England.

ALT Infographic by Sport England showing statistics on how children and young people with two or more characteristics of inequality are more likely to be active, against a backdrop of London landmarks. Percentages of 52%, 47%, and 40% are displayed alongside diverse groups of active individuals.

ALT Infographic titled 'Covid impact on positive attitudes of children' by Sport England showing a decline in positive attitude percentages among children in years 3 to 6 by 4.9% during the academic year 2021-22 compared to 2017-18. The infographic displays four vertical bar charts comparing pre-pandemic rates in 2017-18 to rates in 2019-20, 2020-21, and 2021-22 for age groups years 3-6, 7-8, 9-11. Each group shows a decrease, highlighted by a prominent red downward arrow indicating a 4.9% drop.

ALT Infographic by Sport England highlighting the gender gap in physical activity between boys and girls in England for the year 2023-24. The image shows two arrows with percentages: 51% of boys are active, down from 54.7%, and 45% of girls are active, up from 47.1%, indicating a current gap of 6.4%. Figures are depicted standing on each arrow to represent boys and girls.