

James Webb - Everything That's Hot 🔥
- Tweets2.9K
- Following37
- Followers1.7K
- Likes224




ALT Mid-infrared view of a region in the LMC from MIRI. The image is composed of a small square image on the left and a larger rectangular image on the right, both revealing detailed structures of gas and dust clouds with embedded stars.

ALT Wide-field view of the galaxy cluster Abell 370 captured by NIRCam. The image is split into two panels, each filled with a dense population of galaxies appearing as small, bright points of light against a dark background. Some galaxies show distinct spiral structures and lensing effects.

ALT A collage of four images showing a dusty nebula. Two-thirds of the collage is taken up by a single image of the nebula, while the remaining third shows three insets stacked on top of each other. In the largest image at left, there is an orange and yellow fang-like cloud of matter that cuts the image in two. The left side of the fang shows more clouds of a dark brown shade, while the right shows filaments of light brown. There are a number of bright blue and red points of light spread throughout, three of which are circled in white and labeled with a number from one to three. Circle 1 is located at about 12 o’clock in the middle of the fang-like cloud, while Circle 2 is at about 5 o’clock and Circle 3 is located at about 7 o’clock, toward the bottom left of the image. Each circle magnifies an individual object, which is shown in each of the three squares to the right of the collage, labeled 1 to 3 from top to bottom. Each image contains a single, fuzzy point of light in the middle.

ALT A collage of three near-infrared images showing a dusty nebula. The left two-thirds of the collage is taken up by a Hubble image of the nebula. The remaining third is taken up by two Webb images, one atop the other. The Hubble image has a pillar of dense brown dust running through the nebula at a diagonal from 5 o’clock to 11 o’clock. Wispy plumes appear to fly off from the pillar toward the sides amid blue clouds of the same material, which are whiter near the pillar. There are many white stars spread throughout. Two separate, white squares, tilted about 30 degrees, outline two areas in the pillar. The upper square has the letter “A” to the top right, while the lower square is marked by the letter “B”. These labels correspond to the two, magnified images of the nebula at right, with the top image also labeled “A” and the bottom image labeled “B”. Both images contain a mixture of reds, blues and browns, and show red, blue, and white stars.

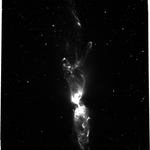
ALT A raw, black and white image of Lynds 483 showcasing a prominent, vertical jet structure emanating from a bright, compact source at the bottom. The jet appears as a luminous, textured column against a stark black background punctuated by numerous faint stars. The image emphasizes the structural details of the outflow without color information.

ALT A NIRCam (Near-Infrared Camera) image of the dark cloud Lynds 483, highlighting a powerful bipolar jet. The jet is brightly illuminated with a mix of red, green, and blue hues, indicating different ionized gases and dust. It extends vertically from a bright, star-forming region at the bottom, against a backdrop of numerous faint stars. The image showcases the detailed structure and complex emissions within the cloud.

ALT A MIRI (Mid-Infrared Instrument) image of the protostar HOPS-96. The image features a large, dark, amorphous cloud formation dominating the center, surrounded by wispy, illuminated nebulosity with hints of brown and orange tones. Two prominent stars with diffraction spikes are visible, along with several fainter point sources against a dark background. A smaller, square inset in the top left corner shows a fainter, more diffuse view of the same region.

ALT A side-by-side comparison of two slightly different Hubble Space Telescope images of NGC 5139, a globular cluster, showing a dense field of stars against a dark background.

ALT At the centre is a thin vertical cloud known as Lynds 483 (L483) that is roughly shaped like an hourglass with irregular edges. The lower lobe is slightly cut off. The top lobe is seen in full, petering out at the top.

ALT In celebration of the 31st anniversary of the launch of the NASA/ESA Hubble Space Telescope, astronomers aimed the celebrated observatory at one of the brightest stars seen in our galaxy to capture its beauty. The giant star featured in this latest Hubble Space Telescope anniversary image is waging a tug-of-war between gravity and radiation to avoid self-destruction. The star, called AG Carinae, is surrounded by an expanding shell of gas and dust. The nebula is about five light-years wide, which equals the distance from here to our nearest star, Alpha Centauri.

ALT A Hubble Space Telescope image of the Bubble Nebula, showcasing a large, spherical shell of glowing gas with a distinct blue hue. Wisps of yellow and gold are visible along the edges and within the bubble's structure.

ALT A MIRI (Mid-Infrared Instrument) image of the Westerlund 2 star-forming region featuring a complex nebula with bright yellow and green emission, revealing intricate structures and dark areas. The image is presented in a mosaic format with separate panels.

ALT Imaging of zC406690 from various observations, showing a ring-like structure in spatially resolved images. The contours in all panels trace the JWST/NIRCam F444W emission. The Hα kinematic center is marked by the red cross. Top row: composite RGB image from NIRCam F115W, F277W and F444W (PSF matched to 0.15′′ using WebbPSF and Photoutils, left panel); composite RGB image from HST H, J and F814W bands (PSF 0.15′′, middle panel); Top right: Hα moment zero map from VLT/SINFONI (PSF 0.18′′, right panel). Bottom row: low-resolution ALMA archival observations of the CO(4-3) emission (PSF 1.5′′, integrated S/N=7), 142GHz continuum (PSF 1.5′′, peak S/N=4.5) and 236 GHz continuum (PSF 0.74′′, peak S/N=2.5).

ALT JWST NIRCam color image of WFI2033-4723 (GTO Program #1198; PI: Stiavelli). The F115W band is mapped to the luminosity and blue, F150W to cyan, F277W to yellow, and the F356W band to red. Near the bottom image, there is a bright spot on the lower-right side that maps back to other bluer regions of the ring, indicating it is a multiply-imaged star-forming region (SFR) contained in the z∼1.6 host. Preliminary models place the physical size at ∼150pc located ∼2kpc from the center of the galaxy (assuming flat CDM cosmology with h = 0.7 and m = 0.3).

ALT This mid-infrared image from MIRI showcases the planetary nebula NGC 1514, often called Crystal Ball Nebula. It appears as a roughly spherical, glowing cloud with a complex structure. The nebula exhibits a range of colors, from a bright white outer shell to a mottled interior of red, pink, and blue hues, suggesting varying temperatures and compositions of the ejected stellar material. A bright central star is visible at the nebula's core, surrounded by a faint, star-like halo. The dark background is sprinkled with a few distant stars, while the bottom right corner of the image includes text stating "Processing M. Hakan Özsaraç Science NASA, ESA, CSA, STScI".

ALT NIRCam captures the detailed structure of NGC 5643, a spiral galaxy with a bright core and prominent spiral arms. The image highlights the instrument's ability to resolve dust lanes and star formation regions, as well as the diffraction patterns of foreground stars.

ALT This infrared image shows a faint, hazy nebula surrounding the protostar CB-26. The nebula has wispy clouds of red, orange, and white, set against a dark background sprinkled with stars. Two brighter stars shine near the top, and a smaller, redder nebula can be seen at the bottom left.

ALT A close-up view of the Horsehead Nebula's edge captured by NIRCam, revealing the intricate texture of the cloud's upper layer. A central bright star, with its characteristic eight-pointed diffraction spikes, dominates the image. Faint, distant galaxies are scattered throughout the deep space background, which has a reddish tint.

ALT Coadded images of NGC 1514 at 7.7 µm (upper left), 12.8 µm (upper right), 25.5 µm (lower left), and a three-color composite image of the three. The origin (0′,0′) corresponds to the position of the central binary star.

ALT The graphic has two parts. On the left are light curves showing the change in brightness of three sets of near-infrared wavelengths over time. On the right is a cross-section of the object’s atmosphere, showing the altitude that each set of wavelengths originates and their relationship to cloud layers or temperature.