
The Wide Angle Search for Planets, searching for transiting exoplanets.
- Tweets989
- Following57
- Followers506
- Likes358









ALT Artist impression of glory on exoplanet WASP-76b.


ALT An artist's concept illustration shows a gas giant exoplanet with clouds and bands in shades of orange. It is labeled WASP-189 b, a giant planet composed mainly of gas, with hypothetical visualization labeled in the bottom right corner.

ALT An illustration depicting the exoplanet WASP-121 b. The planet dominates the foreground on the left side of the image, and appears banded with colors of red, yellow, and orange. Behind the planet is a large star that appears similar in size to the exoplanet. The background is made up of fuzzy light gray nearer to the star, and darker grays at the edges. The words Artist's Illustration are in white in the bottom right corner of the image.



ALT Illustration of a cloudy, striped purple planet on a dark starry background. This planet is labeled “WASP-80 b.” On the right, two lines connect from the planet to a labeled circle filled with representations of the chemical methane. Each methane molecule has four blue hydrogen atoms bonded (gray sticks) to a central red carbon atom. An “artist’s concept” label is in the bottom right corner.


ALT A hot planet transits in front of its parent star in an artist impression of an exoplanet system.


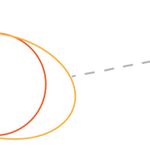
ALT A schematic representation of the ECMI emission process between an exoplanet, exomoon, and exoplasma-torus. The satellite semimajor axis as is defined by dynamics and stability criteria (Cassidy et al. 2009), the mass-loss by stellar tides and irradiation (Oza et al. 2019), and the scale height defines the volume of the plasma torus responsible for the beamed emission $S_{\nu _\mathrm{ c}}$. The cyclotron frequency νc = 2.8 Bp determines the selected observational frequency and can result in non-exomoon emission (gray cone) and radio-loud exomoon-exoplanet emission (black cone) based on the field strength at the satellite orbit Bs ∼ Bp (Rp/as)3.

ALT Position of the three selected planets in the radius-period and mass-period planes. LTT 9779 b and TOI-674 b clearly populate the sub-Jovian savanna in both cases, while WASP-156 b is on the border. The planetary parameter data base is the same as in Szabó et al. (2023).


ALT Graphic titled “Exoplanet VHS 1256 b Emission Spectrum,” displaying the composition of a distant planet’s atmosphere. The label at top right explains that the data is from Webb’s NIRSpec and MIRI instruments and used the IFU Medium-Resolution Spectroscopy mode. The spectrum is plotted on a graph showing a white, downward-trending jagged line. The Y axis is in “amount of light emitted” and goes from “less” to “more,” and the X axis is in “wavelength of light” and has a logarithmic scale going from less than 2 to more than 15 microns. Semi-transparent, color-coded bars along the jagged line correspond to the labeled signatures of water (5 blue bars), carbon monoxide (2 red bars), methane (2 purple bars), and silicates (2 gold bars) in the data. In the background is an illustration of a deep orange, striped planet, partially covered by the black rectangular area of the graph.


