

Data-driven visual content focused on global trends, investing, technology, and the economy. 📲 Creator on @VoronoiApp
Vancouver, BC
Joined August 2011
- Tweets17.5K
- Following3.3K
- Followers363K
- Likes2.3K



Mapped: The Male-to-Female Ratio in Every Country 👥
This graphic by Iswardi Ishak is one of the many incredible data-driven charts and stories from creators featured on our @VoronoiApp. ✅
voronoiapp.com/demographics/…

Ranked: The World’s Biggest Carbon Emitters 🌍
visualcapitalist.com/ranked-…

Ranked: America’s Biggest Farm Economies in 2025 🌾
visualcapitalist.com/ranked-…

Ranked: The Most Educated Countries in the World 🎓
visualcapitalist.com/most-ed…

U.S. gold IRA assets grew 38-fold over the past 20 years, rising from $2 billion in 2005 to $76 billion in 2025 🥇
Created in partnership with @USMoneyReserve, this graphic shows the estimated growth of gold and silver IRA assets over the past 20 years.
visualcapitalist.com/sp/usmr… #usmr01

Ranked: Countries That Owe the Most Money to the IMF 💰
visualcapitalist.com/countri…

Ranked: The World’s Best and Worst Cities for the Environment 🌱
visualcapitalist.com/ranked-…

Explore more World Risk Poll insights on disaster warnings and action: visualcapitalist.com/sp/lrf0…

Among disaster-affected people worldwide who received no warning, what share own a mobile phone?
18%About one-quarter
12%About one-fifth
24%About half
45%About three-quarters
99 votes • 1 daysSunday Digest 📊
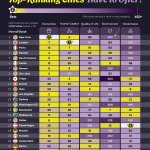
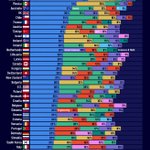
Which cities rank among the world's top 25 in 2026? Which country is actually the richest in the world? And where in Europe are unemployment rates the highest?
Swipe through for some of this week’s featured data stories.
📩 Want the full week in data? Subscribe to Visual Capitalist’s free daily newsletter to get our latest stories and visuals delivered straight to your inbox.
visualcapitalist.com/subscri…


Flashback Favorite 🔙
Visualized: The Most Common Master’s Degrees in 43 Countries 🎓
From the Archive: visualcapitalist.com/visuali…

Mapped: Where Millennials Own vs. Rent in America 🏠
visualcapitalist.com/mapped-…

Ranked: The Most Used AI Chatbots in 2026 🤖
visualcapitalist.com/most-us…

Germany’s 17 Million Immigrants: Where They Come From 🌍
This graphic by @datapulse_de is one of the many incredible data-driven charts and stories from creators featured on our @VoronoiApp. ✅
voronoiapp.com/migration/17-…

Visual of the Week 🥇
American Pit Bull Terriers and German Shepherds led 11 states combined in 2025, but none in 2026. Now, 24 states have a new top breed, with Yorkshire Terriers making the biggest gains.
visualcapitalist.com/mapped-…

Generative AI app spending grew nearly 200-fold between Q1 2022 and Q1 2026, reaching almost $2 billion 🤖
Created in partnership with @Plasma, this graphic tracks generative AI app spending by region since 2022.
visualcapitalist.com/sp/pla0… #pla02

See how the ability to act changes as people receive warnings through more channels: visualcapitalist.com/sp/lrf0…
In the 2025 World Risk Poll, roughly how many people who received a disaster warning were able to take action as a result?
63%1 in 4
11%1 in 2
9%2 in 3
16%4 in 5
128 votes • Final resultsRanked: Countries Where People Trust Each Other Most 🤝
visualcapitalist.com/ranked-…

Mapped: Where China Out-Trades the U.S. and EU (2000 vs. 2025) 🌐
visualcapitalist.com/mapped-…
