

Market structure, Altcoin order flow, and trading automation. Daily breakdowns. By @learnernoearner
UT Trading Academy
Joined June 2024
- Tweets5.6K
- Following99
- Followers8K
- Likes3.1K


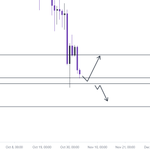
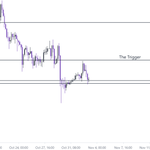


Could this be anymore accurate??
$ETH
Triggered the long setup →
Reached the target →
and right back to the floor
Wanna know what's next?
Follow


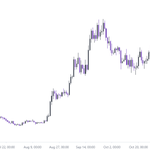
The chart for last 2 months shows one thing: pure exhaustion.
$ETH has bled relentlessly, sentiment is in the dirt, and daily RSI is sitting near oversold (31).
But structure-wise, we're at the exact line in the sand.
Here's what matters:
1. The Floor: $2,240–$2,250
Lose this on a daily close and the bleed accelerates straight toward $2,000.
2. The Trigger: $2,320
Price is trapped under heavy supply. Until $2,320 (daily 200 EMA) is reclaimed, every bounce is just exit liquidity.
Flip $2,320 and the squeeze to $2,450+ is on.
Lose $2,240 and it gets ugly.
Trade the reaction at the edges to snipe the best moves.

$SOL couldn't hold the $98 floor
Closing below it printing 7% drop right away
$SOL HTF OUTLOOK
30 days grinding down from $125 straight into the daily 200 EMA near $98.
That sweep finally stalled the bleed and kept macro structure off life support, but momentum hasn't flipped. Still just ranging in relief.
What decides the next:
- Bulls don't take back control until the daily closes firmly over $110.
- The bull case: Defending $98 keeps the weekly higher-low structure intact. Reclaiming $110 clears the path for a macro rotation back into $130+.
- The invalidation: Lose $98 on a HTF close and swing structure breaks completely, triggering a clean liquidity flush into the $77 pocket.
Trade the boundary levels. React to $98 and $110, stop overthinking the middle.

$RENDER has been taking a beating, but sellers are now approaching a key support zone.
The $1.46–$1.48 area is crucial, with the 4H RSI near oversold at 31.
If $1.47 holds, a relief bounce toward $1.56 is possible.
Lose $1.46 on a daily close, and $1.38 comes into play.

It took $ETH less than a day to execute the play
Held The Floor ($2,240–$2,250), bounced toward resistance, but failed to reclaim The Trigger ($2,320)
Now back at the floor, awaiting confirmation of the next move
Above $2,320 → $2,450+
Below $2,240 → $2,000

The chart for last 2 months shows one thing: pure exhaustion.
$ETH has bled relentlessly, sentiment is in the dirt, and daily RSI is sitting near oversold (31).
But structure-wise, we're at the exact line in the sand.
Here's what matters:
1. The Floor: $2,240–$2,250
Lose this on a daily close and the bleed accelerates straight toward $2,000.
2. The Trigger: $2,320
Price is trapped under heavy supply. Until $2,320 (daily 200 EMA) is reclaimed, every bounce is just exit liquidity.
Flip $2,320 and the squeeze to $2,450+ is on.
Lose $2,240 and it gets ugly.
Trade the reaction at the edges to snipe the best moves.

The chart for last 2 months shows one thing: pure exhaustion.
$ETH has bled relentlessly, sentiment is in the dirt, and daily RSI is sitting near oversold (31).
But structure-wise, we're at the exact line in the sand.
Here's what matters:
1. The Floor: $2,240–$2,250
Lose this on a daily close and the bleed accelerates straight toward $2,000.
2. The Trigger: $2,320
Price is trapped under heavy supply. Until $2,320 (daily 200 EMA) is reclaimed, every bounce is just exit liquidity.
Flip $2,320 and the squeeze to $2,450+ is on.
Lose $2,240 and it gets ugly.
Trade the reaction at the edges to snipe the best moves.

$BTC is boxed between two liquidity pools.
Above: $78.7k - $79.6k, shorts stacked three bands deep
Below: $76k, the brightest band on the 7-day map
$78.1k now. closer pool up, bigger pool down.
$79.6k or $76k first?
$NEAR is pressing into a supply wall and shorts are leaning on it.
$4.52 - $4.58 is where the 1h and 4h 200 emas stack.
1h close above $4.58: $4.75 / $4.90
rejected at $4.58 or lose $4.40: $4.25
Let 4.58 decide.

$SUI bulls got a wick. Bears got $0.850.
$0.988 never printed. $0.900 broke on the 1h close and $0.850 hit within hours. low 0.8277.
+5.56%✅
Reclaim it this week, or 0.8277 first?
$SUI is suffocating between $0.900 and $0.946.
Sellers dumped it straight into demand at $0.900 and got nothing for it. Buyers can't even lift it through $0.946, with the 1h 200 EMA pressing down from $0.963.
Macro trend is heavy, but someone is clearly absorbing every dip into $0.900.
Hourly close above $0.946 sends it to $0.988.
Lose $0.900 and it flushes straight to $0.850.
Until one snaps, you're just paying fees to chop.
1
8
1,767
$SOL melted straight to $96.0, exactly where we drew it
15m close at $99.13 under $99.5. 45 minutes later, $96.0 was gone.
Short: +3.52%
Long yesterday: +1.97%
Both legs: +5.49%
The 15m close picked the winner twice.
$SOL looks like it's about to fall off a cliff.
Buyers barely defended $99.5 before stalling hard under the 15m 200 EMA.
If $101.5 reclaims, easy squeeze to $103.5. If $99.5 snaps, we melt straight to $96.0.
Trading the middle here is suicide. Let the 15m close pick the winner."
$5.6B just left binance's hot wallets
Suspected hack, Not confirmed yet. If it is, it's the biggest in crypto history, 3.7x bybit.
Tether and Circle already froze about $2.4B of it.
Binance says user funds are "completely safe".
$HYPE is staring down a massive wall at 95.2
4h candle ripped through the 4h emas on 5x average volume. price is pushing into daily supply and 1h rsi is sitting near 85.
Late buyers are trapped between exhaustion and a breakout.
Bull: 4h close above $95.2 → $98.0 cycle high. invalidation: loss of $91.5.
Bear: rejection wick at $95.2 and the 1h structure breaks → $82.7. invalidation: 4h close above $96.0
Structure stays bullish unless $82.7 goes. Chasing here is how you become exit liquidity.
$SOL didn't fall off the cliff.
15m closed at $101.51 - literally one cent over the trigger.
11 hours later: $103.5 tapped. Target hit.
Never trade the chop in the middle. Let the candle close decide.
$SOL looks like it's about to fall off a cliff.
Buyers barely defended $99.5 before stalling hard under the 15m 200 EMA.
If $101.5 reclaims, easy squeeze to $103.5. If $99.5 snaps, we melt straight to $96.0.
Trading the middle here is suicide. Let the 15m close pick the winner."
$BTC faked both directions in the first 5 minutes of fomc
Held at 3.75% to 4.00%, 10-2 vote with two officials wanting a hike. Warsh: ready to act, no date.
$BTC swept $80.7k and $81.2k, then ran to $81,789
Stay tuned for a fresh liquidity map next.
Does $btc break 81.8k on the second try, or is this a double top?

$BTC hunted the $81.1k shorts, then took the elevator down
Stairs up: 22 hours straight into the liquidity elevator down: −1.7% in 5 hours
FOMC at 18:00 utc is next. We'll post the reaction with a fresh map.
After fomc, Does $btc reclaim 81.1k or lose 80k first?
The weekend flush dragged $BTC under 80k and $SOL below 100, leaving majors pinned in a slow consolidation while open interest resets.
Price is chopping around $79.5k, with $78k holding the local floor and $83k capping any serious relief push.
Reclaiming $83k is what flips structure back to the bulls, otherwise expect more sideways bleed while the market digests macro risk.
Stay tuned for more updates.

$BTC doesn't care about the fomc rate today. It cares about warsh's tone
A hold at 3.75% to 4.00% is 91% priced in. December hike odds just jumped to 73%.
18:00 utc decision, 18:30 utc presser. Expect sweeps both ways before a real direction.
we'll post the reaction after the presser.
Does warsh signal a december hike today, yes or no?

$MSTR sold 6,948 $BTC this year. Saylor's "never sell" is over
The stock fell 82% from its peak, $BTC dropped under their $75.6k cost, and the playbook changed: Pause buys, sell Btc for dividends, buy back preferred, buy btc again when the stock trades at a premium.
New rule: "Never be a net seller."
is this smart treasury management, or the first crack in the Saylor model?