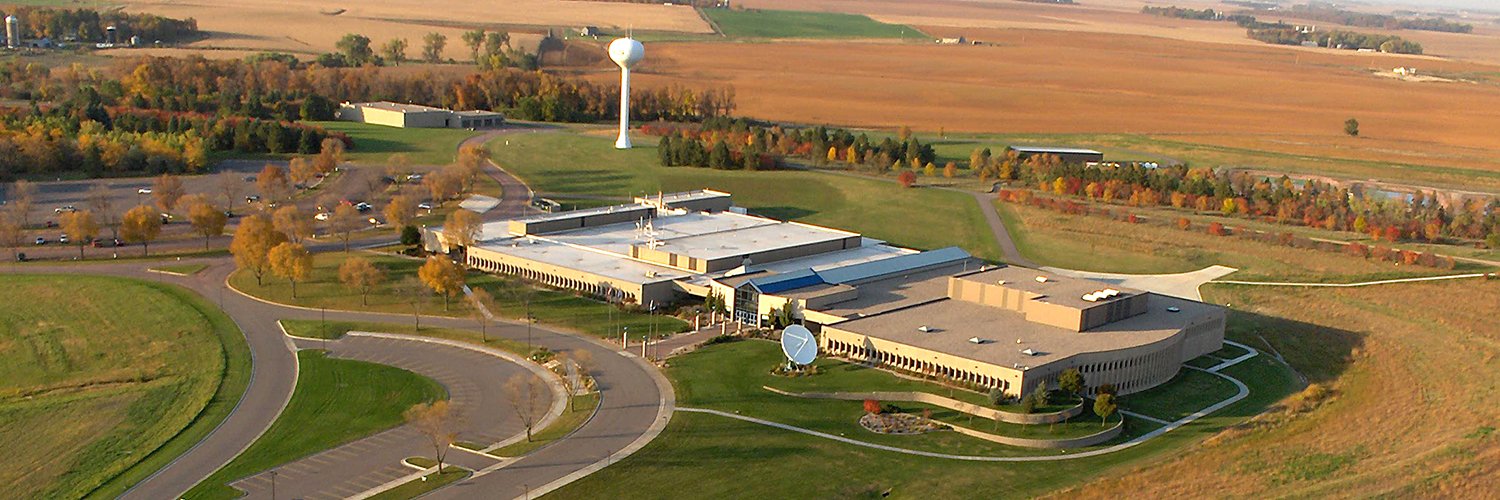
USGS Earth Resources Observation and Science Center. The changing face of your planet: documented, studied & shared since 1973. Questions: [email protected]
Sioux Falls, SD
Joined April 2018
- Tweets4.9K
- Following155
- Followers7.1K
- Likes3K
This land has been a prairie, a chemical weapons plant, and now... a wildlife refuge. 🦅
Welcome to the Rocky Mountain Arsenal National Wildlife Refuge: 15,000 acres just northeast of Denver with one of the most dramatic land-use stories in the country.
Following the attack on Pearl Harbor, the U.S. Army transformed this land into a chemical weapons manufacturing facility to support WWII production. After the war, part of the facility was leased to private industry, and in 1952 Shell Chemical Company began producing agricultural chemicals there. Over the following decades, the Arsenal also produced and dismantled Cold War-era weapons.
By the early 1980s, the Army and Shell began a comprehensive environmental cleanup, carried out under the oversight of federal, state, and local regulatory agencies. During that process, a roost of bald eagles was discovered on site, bringing in the U.S. Fish and Wildlife Service to help manage the area's wildlife. That discovery helped build support for protecting the site and in 1992 Congress passed legislation establishing the national wildlife refuge.
Today, this land is teeming with wildlife, from bison and bald eagles to countless other species that now thrive across the refuge. These two aerial photos, taken more than 60 years apart, show just how dramatic that comeback really was.
See more of the transformation: ow.ly/1kMA50ZWt1U
📸1: USGS aerial photo from September 25, 1953, showing the former chemical manufacturing facility.
📸2: National Agriculture Imagery Program (NAIP) image from August 28, 2017, showing the restored refuge landscape.
Credit: USGS
#NationalWildlifeRefuge #ThenAndNow #EarthShots
The eruption lasted hours. Its effects on rivers and ecosystems are still showing up more than 40 years later. 🌋
When Mount St. Helens erupted, it sent a massive wave of mud, water, and debris downstream, overwhelming the Toutle, Cowlitz, and Columbia Rivers with sediment. Parts of the Columbia Riverbed rose by nearly 30 feet.
The rivers never fully reset. Today, some still carry sediment at rates tens of times higher than before the eruption, creating ongoing challenges for flood protection and fisheries.
The land tells a different story, and it's one that genuinely surprised scientists. Before 1980, experts assumed the blast zone would take generations to recover.
Instead, life came back much faster than predicted. Because the devastation wasn't uniform, pockets of surviving plants and animals became the seeds of entirely new habitats. Today, the diversity of life at Mount St. Helens exceeds what existed before the eruption.
That discovery changed how scientists study recovery after disasters, not just at volcanoes, but after wildfires, floods, and other events worldwide.
In 1982, Congress established the Mount St. Helens National Volcanic Monument, protecting 110,000 acres around the volcano as a living laboratory for studying long-term change.
Landsat has been part of that story from the start, capturing land change recovery one pixel at a time for more than 40 years.
Want to learn more? Explore 10 ways the Mount St. Helens eruption changed our world 👉 ow.ly/WNRZ50ZWsck
📸1: Mount St. Helens, as viewed from the Castle Lake Overlook
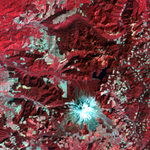
📸2: Landsat 9 image, acquired August 26, 2024, showing Mount St. Helens and the surrounding landscape. Shades of red and pink highlight vegetation regrowth, while the volcano’s north-facing crater and lakes formed by the eruption remain visible.
Credit: USGS
#EarthScienceWeek #MountStHelens #Landsat
Why did Mount St. Helens erupt sideways instead of straight up? The answer was building underneath the surface for months. 🌋
Magma was pushing upward inside the volcano, but it had nowhere to go. The north side of the mountain bulged outward by more than 260 feet, proving to be the weakest point of the mountain.
When that bulge finally gave way on May 18, 1980, it didn't just trigger a landslide — it uncorked the volcano. With the lid gone, the pressure trapped inside blasted out sideways instead of straight up, flattening everything in its path before the eruption even turned vertical.
The result was one of the most dramatic landscape transformations ever captured from space.
Landsat satellites have been orbiting Earth since 1972, and the archive holds a before-and-after record of this eruption that's hard to look at without feeling the scale of it. Thick forest, replaced in an instant by ash and debris — visible not just on the ground, but from 438 miles up.
That transformation didn't stop at the mountain, either. Next, we're following the eruption downstream.
Want to see it for yourself? Click here to view the full-time series:
ow.ly/5yeW50ZWsJg
📸1. Landsat 1 image, acquired September 15, 1973, showing the area around Mount St. Helens before its eruption on May 18, 1980. Forest appears bright red, with patches of logging visible throughout the area. Snow appears white at the summit.
📸2. Landsat 4 image, acquired May 22, 1983, showing the same area a decade later. Ash from the eruption appears gray across the summit and surrounding landscape, replacing much of the white snow cover seen in the earlier image.
Credit: USGS
#EarthScienceWeek #MountStHelens #Landsat
It's Earth Science Week! 🌋 Let's look back at the day Mount St. Helens changed forever.
Before May 18, 1980, Mount St. Helens was famous for its near-perfect, symmetrical shape. Its striking profile even earned it the nickname "Fujiyama of America."
But in the weeks before the eruption, the volcano started changing.
More than 10,000 earthquakes shook the area. Steam explosions repeatedly broke through the surface. And the volcano's north side bulged outward by more than 260 feet.
Then, at 8:32 a.m. on May 18, 1980, a magnitude 5.1 earthquake triggered a massive landslide on the volcano's north flank. The collapse released pressure inside the volcano and unleashed a devastating lateral blast of hot gas, rock, and ash.
Within minutes, an ash column rose about 15 miles into the sky. Ash spread across much of the Western United States, turning day into night in Spokane, Washington, about 250 miles away. In the days that followed, the ash traveled across the country and around the globe.
The eruption didn't just change the landscape around Mount St. Helens.
It changed the mountain itself — and Landsat has been watching ever since.
So, why did Mount St. Helens erupt the way it did? Next, we're going beneath the surface to find out.
📸1: Mount St. Helens before the volcano erupted on May 18, 1980. Spirit Lake is in the foreground.
📸2: Mount St. Helens showing the violence of the eruption in contrast with the quiet countryside, Mount Adams in background. Skamania County, Washington. 1980.
Credit: USGS
#EarthScienceWeek #MountStHelens #Volcanoes
How do you make sure satellite imagery is accurate enough to trust?
Every year, the Joint Agency Commercial Imagery Evaluation (JACIE) Workshop brings together remote sensing experts to answer exactly that question.
JACIE 2027 will focus on system capabilities, calibration, and how data quality impacts real-world Earth observation applications. Attendees will come together to present and discuss new systems, new methods of improving data, and new applications made possible by improved data quality. The workshop is open to all interested parties across government, industry, and academia, including students.
📅Workshop Details:
Date: April 5–9, 2027
Location: USGS Headquarters, Reston, Virginia
In-person registration deadline: March 26, 2027
📝 Planning to present or exhibit? Complete the workshop registration form before submitting an abstract or exhibitor form. Abstracts are due Nov. 20, 2026.
➡️ Register here: ow.ly/Pfcw50ZWun3
What to expect:
🔸 Presentations on new and existing systems
🔸 Side meetings
🔸 Poster session
🔸 Exhibits
📷: Save the date graphic for the JACIE 2027 Workshop.
Credit: USGS
#JACIE2027

ALT Workshop graphic with a map of North America in green against a blue background with white lines. A blue box on the bottom right with the words: Save the date, April 5-9, 2027, Reston, Virginia, Register Today!, presentations, posters, exhibits, meetings and networking. Other text says: JACIE 2027 will bring together remote sensing experts from government, industry, and academia to discuss Earth observation system capabilities, calibration, data quality and applications. Registration link in post.
Look closely — this isn't a photograph. 👀
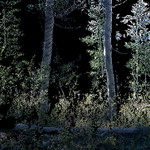
This is a LiDAR (Light Detection and Ranging) point cloud of an aspen grove in California’s Sierra National Forest. Unlike a photograph, this image was created with a terrestrial lidar system (TLS), a ground-based scanner. The scanner sent out millions of laser pulses to measure the distance to trees and plants. Those measurements appear as tiny points that come together to form a detailed 3D view of the forest.
As part of the Fire Science project, USGS EROS scientists used this technology to study how fire affects forest structure and regrowth.
The team spent 12 days near Shaver Lake revisiting 50 forest plots that were first measured between 2000 and 2008. Many of the plots later burned in the 2025 Garnet Fire. Comparing the earlier measurements with current post-fire conditions gives scientists a rare look at how these forests have changed over time.
These data add to a long-term record that scientists can use to study how forests recover after fire.
📸: LiDAR point cloud image of an aspen grove in the Sierra National Forest, California. Credit: USGS
#Lidar #RemoteSensing #FireScience
College students: Classes are back, and 2025 land cover data are ready to explore! 🎓🗺️
Whether you're heading to class in Raleigh, Durham, Chapel Hill, North Carolina, or somewhere else across the country, have you ever wondered how much the landscape around your campus has changed?
The Annual National Land Cover Database (NLCD) lets you take a look. The data map forests, croplands, developed areas, wetlands, water and other types of land cover across the continental United States. The latest data show land cover in 2025, and you can compare it with data going all the way back to 1985.
Created at the USGS EROS Center using Landsat observations, the data provide a consistent annual record from 1985 through 2025.
So, what did your college town look like in 1985?
Learn what’s changed in Annual NLCD Collection 1.2 and how you can access the data👉ow.ly/9cTs50ZSS8e
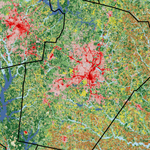
📸1: Annual NLCD map of the Raleigh–Durham–Chapel Hill area in 1985. Developed land appears in pink and red, forests in green, pasture and hay in yellow, cropland in brown, and water in blue. Developed areas are concentrated around the region’s urban centers.
📸2: Annual NLCD map of the same area in 2025. Larger areas of development spread across the center of the map, and are surrounded by forests, farmland, lakes, and waterways.
Credit: USGS
There is always more to explore at USGS EROS. 🛰️
The USGS Earth Resources Observation and Science (EROS) Center in Sioux Falls, South Dakota, is home to satellite imagery and data that help us understand how Earth’s land surfaces are changing.
And you can explore EROS, too!
Free, public tours offer visitors a look at Landsat history, satellite imagery and the work that goes into receiving and preserving Earth observations. Tour stops can include interactive lobby displays, Landsat Operations, the EROS data archive and the radome, where a 10-meter antenna receives data from Landsat satellites as they pass overhead.
Together, these exhibits and facilities offer a look at the science, technology and data behind the Landsat mission and its long-term record of Earth’s changing land surfaces.
EROS is open Monday through Friday, excluding federal holidays, from 8 a.m. to 4 p.m. Staff-guided tours are available at 10 a.m. and 2 p.m. Self-guided tours are welcome anytime during business hours.
Plan your visit: usgs.gov/centers/eros/visit-…
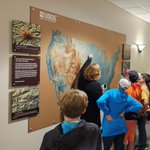
📸1: A tour guide points to a map of the U.S. as students and chaperones gather around during a visit to USGS EROS.
📸2: A group gathers in the lobby beneath a model of the Landsat 8 satellite.
📸3: People learn about historical imagery during a stop in among displays and archive shelving.
📸4: Tour participants make their way to the radome.
📸5: A view inside the EROS radome shows the satellite dish that receives data from the Landsat 8 and Landsat 9 satellites as they pass over.
Credit: USGS
#USGSEROS #Tours
Wildfire’s effects on invasive annual grasses can last long after the flames are gone.
Newly released USGS data examine how invasive annual grasses may respond after wildfires burn across western U.S. rangelands. In some areas, growth of invasive annual grasses can be limited during the first year after a fire and then become more pronounced in following years.
So where are those changes most likely to happen and when?
Using remote sensing data, researchers developed Fire Invasive Response Metric (FIRM) to help land managers answer that question. Short-term FIRM data look at invasive annual grass response 1–5 years after a fire, while long-term FIRM data track potential changes for up to 30 years.
The USGS science team also developed Habitat Invasive Risk (HIR), which bring together expected invasive grass response, the likelihood of fire, and ecological integrity.
Together, these datasets can help land managers identify where invasive grasses may pose a greater post-fire risk and better prioritize monitoring and management efforts.
Download the newly released FIRM and HIR data by following this link.
ow.ly/Uw9550ZMmQh
📸1: Two maps compare invasive annual grass cover one and two years after wildfire across western U.S. rangelands. Green areas show less invasive annual grass cover than before the fire, yellow shows little change, and orange and red show greater cover. More orange and red appear in the second year. Credit: USGS
📸2: Two maps compare invasive annual grass cover three and four years after wildfire across western U.S. rangelands. Green areas show less invasive annual grass cover than before the fire, yellow shows little change, and orange and red show greater cover. By years three and four, increases appear across more of the mapped area. Credit: USGS
How are drought, invasive grasses, and management decisions reshaping western rangelands?
More than 40 years of Landsat observations can help reveal the answer.
Join USGS Ecologist Matthew Rigge for an upcoming webinar exploring RCMAP, the Rangeland Condition Monitoring Assessment and Projection project, and how its data can be used to monitor rangeland change.
Scientists from the USGS and Bureau of Land Management developed RCMAP to help managers understand current vegetation conditions and how landscapes have changed over time.
Using Landsat imagery, RCMAP provides annual maps of vegetation and ground cover across western U.S. rangelands and the sagebrush biome of Canada from 1985 to the present. Weekly exotic annual grass and herbaceous cover products also provide timely information for fire and grazing management decisions.
📅 Webinar Details:
Date: Tuesday, September 22, 2026
Time: 12:00–1:00 PM CDT
Who should attend: Anyone interested in RCMAP data or rangeland vegetation monitoring
➡️ Register here: ow.ly/pnhw50ZMmPi
What You’ll Learn:
🔸 What RCMAP cover estimates represent
🔸 Examples of how the data can support management decisions
🔸 How to access, process, and download RCMAP products
🔸 Answers to questions about the data and available tools
📷: Screenshot of RCMAP data of the southwest United States
Class is back in session. Today’s subject: Earth, seen from above. 🛰️📚
Can you spot the change between these two Landsat images captured one year apart?
Study the landscape of each image. What do you think happened?
The answer: flooding.
Heavy rain caused the Wabash River (on the left) and the White River (on the right) to overflow their banks in the summer of 2008. The two rivers meet near Mt. Carmel, Illinois.
Comparisons like this are part of the online USGS EROS Remote Sensing Classroom, where quizzes and activities built around satellite imagery help people learn to recognize features and interpret changes on Earth.
Explore more imagery and test your observation skills in the USGS Remote Sensing Classroom:
eros.usgs.gov/remote-sensing…
📸1: Landsat image dated June 2007. Narrow, winding dark-blue waterways cross a landscape patterned with bright green, pink, purple, and tan areas.
📸2: Landsat image dated June 2008. Large dark-blue areas appear along several waterways, surrounded by bright green vegetation and patchworks of pink, purple, and tan land.
Credit: USGS
#BackToSchool #RemoteSensing #Landsat
To understand wildlife, sometimes you have to zoom out. 🦆
This National Wildlife Day, we’re highlighting Bear River Migratory Bird Refuge in northern Utah, where wetlands, open water, mudflats, and marshes provide important habitat for waterfowl and other migratory birds.
Archived at USGS EROS, National Agriculture Imagery Program (NAIP) imagery gives scientists and land managers a detailed view of these habitats from above. By mapping features such as water, vegetation, channels, and wetland boundaries, they can better understand habitat conditions and how the landscape is changing.
That information can help guide decisions about wetland management and conservation, supporting the places birds rely on for feeding, resting, nesting, and migration.
📸1: A large flock of waterfowl flies above a wetland, while more birds gather on the water among reeds. Credit: U.S. Fish & Wildlife Service, Jill Shannon
📸2: June 2024 NAIP image of Bear River Migratory Bird Refuge in Utah. Credit: USGS
#NationalWildlifeDay #WildlifeHabitat
A monument to history, captured in the making. 🏗️
The Gateway Arch has become a defining feature of the St. Louis riverfront, and this declassified satellite image takes us back to March 1964, when the landmark was still under construction.
The Arch was built as part of a national memorial commemorating the westward expansion of the United States and the role St. Louis played as a gateway to the West. Construction began in 1963, and the two sides of the Arch met in October 1965, completing its distinctive 630-foot form.
Six decades later, aerial imagery from 2024 offers a modern perspective on the landmark and the riverfront around it.
The images are part of the USGS EROS archive, which preserves millions of satellite and aerial images documenting Earth’s surface across decades. The 1964 view comes from declassified imagery originally collected by the U.S. CORONA reconnaissance program, while the 2024 image was acquired through the USDA National Agriculture Imagery Program (NAIP). Together, these views capture two very different moments in the history of the St. Louis riverfront.
Explore more historical imagery through USGS EarthExplorer: earthexplorer.usgs.gov/
📸1: Black-and-white satellite image of the St. Louis riverfront from March 1964. A yellow box identifies the monument under construction along the Mississippi River. Roads, buildings and river traffic surround the construction site.
📸2: NAIP image of Gateway Arch National Park on July 2, 2024. The completed monument casts a long, curved shadow across the park grounds.
📸 Credit: USGS
#GatewayArch #StLouis #HistoricImagery
Looking for satellite or aerial imagery? Start with USGS EarthExplorer. 🛰️🌎
EarthExplorer makes it easy to search, browse, and download satellite data from the USGS EROS archive.
Whether you’re using EarthExplorer for the first time or looking for a quick refresher, this tutorial walks through the basics to help you get started. You’ll learn how to access imagery and other landscape data for your next project or exploration.
Watch the tutorial: ow.ly/tMRJ50ZyJpx
📷: Screenshot from the "How to Use USGS EarthExplorer to Download Imagery" video. Credit USGS
#EarthExplorer #Landsat
📣Job Announcement
Join the U.S. Geological Survey (USGS) as a Geographer or a Physical Scientist and help lead national land-change monitoring efforts.
This position will provide technical leadership and serve as the project manager and coordinator for land-change monitoring activities at the USGS Earth Resources Observation and Science (EROS) Center.
🌎 Location: Sioux Falls, South Dakota
🗓️ Closing date: September 1, 2026
Some specific duties include:
• Managing land-cover monitoring, assessment, and projection activities at USGS EROS, including project planning, budgeting, coordination, and oversight.
• Leading the development and oversight of national-scale land-change monitoring products, including moving new research and methods into operations.
• Coordinating with external partners and stakeholders, including supporting the Multi-Resolution Landscape Characteristics (MRLC) Consortium and sharing scientific and technical expertise.
• Providing technical leadership in remote sensing and land-cover mapping and advancing the use of these technologies for land-change monitoring, assessment, and projection.
🔗 Open to the Public: usajobs.gov/job/880228300
📸: A 2025 Annual National Land Cover Database (NLCD) map shows the tornado’s path through southern Kentucky near Somerset and London. Yellow represents pasture and hay, brown is cropland, dark blue is open water, and pink and red indicate developed areas. The light tan line, indicating the tornado’s path, shows where the land cover shifted from forest to grass.
We brought satellite science down to Earth at Discover Aviation Day in Sioux Falls! ✈️🛰️🌎
Thanks to everyone who stopped by the USGS EROS booth to explore how Earth observation, remote sensing, and geospatial data help us understand our changing landscapes.
Visitors tested their skills with our new Lens Match game, pairing imagery collected from the ground, aircraft, and satellites while learning how these different perspectives support science and everyday decision-making.
The thermal imaging demonstration was a crowd favorite, giving visitors a hands-on look at how Landsat satellites measure Earth's surface temperature. These data help scientists monitor agricultural water use, detect wildfires, and support disaster response.
Want to keep exploring? Visit our Remote Sensing Classroom to learn how scientists use satellite imagery to understand changes on Earth’s surface: ow.ly/OumJ50ZwjHV
📷 1: USGS scientist shows visitors a “Your Name in Landsat” bookmark.
📷 2: Young visitors explore how Landsat imagery helps scientists observe changes on Earth through hands-on activities.
Showcasing the birthplace of the United States from above. ✈️
Independence Hall in Philadelphia, Pennsylvania, played a prominent role as our country began. The Declaration of Independence was adopted there on July 4, 1776, and signed by most delegates of the Continental Congress on August 2, 1776. Older than the United States, Independence Hall still welcomes visitors to envision the courage and conviction of early leaders who once stood there.
Starting in the 1750s, the Liberty Bell rang in the tower of Independence Hall to summon lawmakers. Now it stands within view of the hall: Silent but still beckoning. Cracked, yet its message intact.
This aerial National Agriculture Imagery Program (NAIP) image from the USGS EROS archive shows the central Philadelphia location of these icons of our independence. NAIP imagery is collected periodically over the United States by the U.S. Department of Agriculture.
Browse the NAIP archive on USGS EarthExplorer for more notable sites: earthexplorer.usgs.gov/
📷1: This NAIP image shows the long Liberty Bell Center (A) and Independence Hall (B) at the lower end of Independence Mall. Just above the Liberty Bell Center is the President’s House site, where George Washington and John Adams lived during their presidencies.
📷2: Independence Hall, originally known as the Pennsylvania State House, has a statue of George Washington in front. The steeple that once contained the Liberty Bell now holds the Centennial Bell, which was made from four melted cannons and placed there in 1876. Credit: National Park Service
📷3: The Liberty Bell, originally called the State House Bell, bears this message: “Proclaim Liberty Throughout All the Land Unto All the Inhabitants thereof.” The bell weighs about a ton. The original narrow split in the bell is believed to date to the 1840s. A failed repair attempt in 1846 intentionally widened the crack but unintentionally created a second crack. Credit: National Park Service
#America250
Every wildfire leaves a signature on the landscape. More than 200 new maps now help tell that story. 🔥
Long-term fire records help scientists and land managers understand how burned landscapes change over time and prepare for future fires.
The Monitoring Trends in Burn Severity (MTBS) program recently added more than 200 fire maps, extending its record from 1984 through 2025. With an archive of more than 30,000 maps, MTBS data support land management decisions and are widely used in scientific research.
Check out the latest MTBS fire maps on this interactive viewer: ow.ly/sflr50ZiqYB
📷1: This photo taken August 18, 2025, shows smoke billowing from the Cottonwood Peak Fire. Photo credit: Forrest Peterman, Bureau of Land Management
📷2: One of the new MTBS maps includes the Cottonwood Peak Fire ignited by lightning in August 2025; it grew to be the largest wildfire of the year in Nevada. The fire burned more than 137,000 acres of sagebrush and grass, along with some forest, in Elko County. About 1,000 people worked on the fire, which threatened ranches and prompted evacuations. The map shows varying levels of burn severity and the fire’s location in north central Nevada. Credit: USGS
#wildfire #FireMapping #BurnSeverity
Learn from the past to plan for the future! A 40-year view of America's western rangelands is now available.
New maps showing annual changes in grasses, shrubs, trees, bare ground, and more can help federal and state land managers, habitat managers, and researchers make future management decisions and assess wildlife habitat and overall rangeland health.
The RCMAP (Rangeland Condition, Monitoring, Assessment, and Projection) team at USGS EROS made significant improvements to the production process for this new release, which spans 1985–2025. The maps provide annual percent cover estimates for 10 vegetation and land cover components, including several types of shrubland and grassland.
Learn more about RCMAP's data and applications: ow.ly/4v9150Zir82
📷1: Cattle grazing on irrigated rangeland in central California.
📷2: A 2025 RCMAP map of the percentage of herbaceous (grass) cover, both annual and perennial, across the western United States.
📷3: A 2025 RCMAP map of the percentage of sagebrush across the western United States.
Credit: USGS
#rangeland #shrubland #grassland
America, from space. 🛰️
To celebrate America's 250th anniversary, the USGS has created a new portrait of the nation using imagery from Landsat 8 and Landsat 9.
For more than 50 years, the @USGS and @NASA Landsat program has provided a continuous record of Earth's changing land surface. This new mosaic showcases the incredible diversity of the United States, from the rainforests of the Pacific Northwest to the Everglades of Florida, from the Rocky Mountains to the agricultural heartland of the Great Plains.
It also continues a tradition that began in 1976, when Landsat imagery was used to create "Portrait U.S.A." for the nation's bicentennial.
Learn more about this image (also available as a poster) and download a free high-resolution copy 👉ow.ly/hLPn50ZjKhS
📷: Landsat Portrait of America, created using imagery from Landsat 8 and Landsat 9 and elevation data from the USGS National Elevation Dataset.