

Trend first. Scenarios, not predictions. Weekly trend + where my orders are, posted before the move. Calm when the market isn’t. Tools on TradingView ↓
Joined January 2021
- Tweets10.7K
- Following292
- Followers21.1K
- Likes3.6K



Pinned Tweet
$ADA monthly.
Three cycles. Three drawdowns:
2018-20: -98%
2021-23: -92%
2024-26: -89%
The community stayed every time. Holding isn't a plan. Knowing where the trend flips is.
Weekly flips bullish only above 0.323. Cycle low: 0.14.
Until then: no chase. NFA
$ADA daily.
It lost the green Rider Band, which just turned gray. That means mixed, not bearish yet.
Price is sitting on short-term support at 0.215.
The weekly is still bearish, so no longs here.
What I'm watching:
1. Daily close back above 0.234: price is back in the band and the bounce is still alive.
2. Holds 0.215–0.234: chop, nothing to do.
3. Daily close below 0.215: 0.182, the long-term support, comes into play.
Green band means bullish, gray means mixed. The thin yellow line is short-term support, and the thick one is long-term.
NFA
$ADA weekly.
It pushed into the bearish band, wicked to 0.28, got rejected, and is back on the band's lower edge at 0.22.
It only flips bullish on a weekly close above the band, around 0.31.
Scenarios, not predictions:
1. Weekly close above 0.31: the trend flips bullish and buy setups come back.
2. Holds 0.20–0.31: range, no trade.
3. Weekly close below 0.20: 0.17 and 0.14 come into play.
Strategy #1 on the weekly agrees. No active setup, and no buy order while the trend is bearish.
It isn't stretched either. Weekly RSI only hits 70 at 0.446 and 30 at 0.05. Price is in the middle, with no edge.
Red is the bearish band. The noise doesn't change the plan. The levels do.
NFA
Bitcoin dominance just hit 60.7%, the highest in 14 months.
Last week the median top-100 altcoin fell 9.3%. Bitcoin fell 2%.
If you hold alts and it feels like you're bleeding while BTC barely moves, that's not in your head. Money is moving to Bitcoin first.
It has happened in every cycle. How long it lasts is the part nobody knows.
Same holder tool, now on $BTC. Weekly closes only. And the picture looks nothing like ADA.
1/ Where BTC sits
Holder plan: "Hold — uptrend."
Trend: up. Sentiment: neutral, not greed.
Price: 81,700.
2/ The ceiling (blue band)
This time the overheated zone isn't far off:
TP1 88,972 (+9%) · TP2 94,921 · TP3 100,870
That's where I'd start selling in steps. Not before.
3/ The buy zones (yellow boxes)
BTC already had its two deep-value zones this cycle, one in early 2026 and one in mid-2026. Price left both behind and turned the trend up.
If it ever comes back down, the projected zones are B1 59,680 (-27%) · B2 50,729 · B3 41,777.
4/ The track record
Buy steps in the zones: 12 closed, and all 12 were higher 52 weeks later, with a median of +109%. 3 are still open. But price usually dropped about another 20% first, which is why buying in steps matters.
Sell steps at the ceiling: only 6 of 18 worked. Price typically kept climbing, another 115%.
BTC punishes people who sell early. That's why the plan sells slowly.
5/ What I'm watching
If a week closes into 88,972: a first trim, and a small one.
If price pushes to 94,921 and then 100,870: trim more, in steps.
As long as the trend reads up and price stays out of the buy zones, the plan is simple: hold.
ADA is bouncing inside a downtrend. BTC is holding inside an uptrend. Same tool, different plan.
NFA.
Trend Rider retweeted

$ADA closes the daily candle right above the 200 MA
We now want to see volume and a big bounce.


If you hold ADA, you probably only care about two things: when to buy, and when to take profits.
I built a tool for exactly that. It only uses weekly closes. Here's how it reads the chart, and what it's showing right now.
1/ The ceiling (blue band)
Every cycle, ADA has stretched far above its own trend. That's the overheated zone. The tool breaks it into three take-profit steps:
TP1 0.357 · TP2 0.437 · TP3 0.556
The point is to sell in steps. Nobody nails the top.
2/ The buy zones (yellow boxes)
On the other side are the deep-value zones, where buying for the long term has historically paid off. You can see them in 2022–23 and 2024. The 2025–26 one is still open, and underwater.
3/ The track record
Buy steps in the zones: 13 of 18 were higher 52 weeks later, with a median of +66%. But price usually fell further first, so buying in steps matters too.
Sell steps at the ceiling: 6 of 12 worked.
So buying in the zones has been more reliable than calling tops. That's why the plan sells gradually.
4/ Where we are now
ADA lost its last buy zone, dropped to 0.14 and bounced. That bounce has now run back into the old zone (0.26–0.27), and the old zone is acting as resistance.
Holder plan: "Rebound — macro trend still down."
Sentiment is back to greed. The trend hasn't turned.
5/ What I'm watching
A weekly close above 0.27: the rebound turns into a recovery, and TP1 at 0.357 is next. That's a level to trim at, not one to chase.
A rejection, with price stuck between 0.19 and 0.26: nothing to do. Wait.
A loss of 0.19: the projected buy zones come into play. B1 0.143, B2 0.122, B3 0.100. Historically, that's where buying made the most sense.
The noise doesn't change the plan. The levels do.
NFA.
Probability Clouds just hit 107 boosts in its first day on TradingView 🚀
Already the #3 most boosted Rider Algo script , only behind indicators from 2022.
The idea is simple:
☁️ Probability clouds for trend scenarios
🎯 A clear entry level, not a prediction
Scenarios, not predictions. Trend first.
Search “Probability Clouds + Entry Level [Rider Algo]” on TradingView.
it’s free and open-source.
What pair should I test it on next? 👇
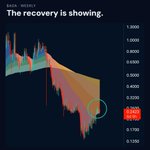
$ADA monthly.
The 2023 floor broke, price wicked to 0.14 and is now back at the same line from below.
Monthly close above ~0.23 = floor reclaimed, the breakdown was a trap.
Rejected here = old support becomes resistance.
15 days left. NFA
$ADA daily.
Back inside the trend band. Daily still bullish, weekly still bearish. No chasing.
Scenarios, not predictions:
1. Daily close holds the band → wait
2. Sudden flush to the optimizer line → limit 0.1816
3. Close below 0.1479 → plan off
Orange = trend band. NFA
Same $ADA weekly, different lens.
The MA band shows the recovery, but the colors are all still red.
How I'd read the turn:
1. First green waves → the reversal starts
2. Price above the band for a few weeks + all green → full trend change
Until then: a bounce, not a flip.
$ETH weekly.
-8% this week. Not a breakdown: first retest of the trend band since the breakout.
Scenarios, not predictions:
1. Weekly close above 2,455 → retest holds
2. Closes inside the band → range, no trade
3. Close below 2,300 → 2,000 / 1,600
Grey = band flipping. NFA

$BTC monthly.
June: BTC dumped straight into the optimizer line (~59k).
The buy order was already sitting there. It filled. Price is ~40% higher since.
Now: no active setup. Nothing to chase.
Next buy only if price comes back to the line.
Green line = optimizer line. NFA

Most traders don’t lose money in the crash.
They lose it in the bounce, chasing the first green candle.
My rule: the order is placed before the move. Limit at the trend line, stop below, targets set.
If price never comes back, I don’t trade. That’s the plan working.
$ADA weekly.
Entering the bearish trend band, same zone as before the Nov ‘24 breakout.
Scenarios, not predictions:
-Weekly close above 0.323 → trend flips bullish
-Rejected inside the band → range, no trade
-Close below 0.22 → 0.18 / 0.14
Blue = bearish band. NFA


Main Bitcoin resistance broke a few weeks ago , 93k incoming then probably more consolidation again.

Hey Riders, I wanted to know what you're most interested in learning.
I want to start putting out content again, but in a more educational way.
48%Use Trading Indicators
48%Trade with AI
4%Other (please specify :)
23 votes • Final results