







TradingClubBTC retweeted

⚡ Day 3 of the #CoinAnk BTC Forecast Challenge – Ready to win more USDT?
Every day, a new chance to prove your market instincts 🧠💸
🗓️ Predict BTC’s price at 00:00 UTC on May 4!
✅ Join in:
1️⃣ Follow @coinank
2️⃣ Like & RT
3️⃣ Comment with your prediction & CoinAnk screenshot
🕒 Deadline: May 3 at 23:00 UTC
🎁The single closest forecast wins 5 USDT – based on Binance spot price
📌 One entry/day
📸 Screenshots showing CoinAnk required!
#BTC #Crypto #Prediction #Bitcoin

TradingClubBTC retweeted
🚨 Day 2 of the #CoinAnk BTC Prediction Challenge is LIVE!
Think you can predict where #Bitcoin will land tomorrow? 💰
🔮 Drop your price guess for May 3, 00:00 UTC!
✅ How to enter:
1️⃣ Follow @coinank
2️⃣ Like & RT
3️⃣ Reply with your BTC prediction + CoinAnk screenshot
🕒 Deadline: May 2 at 23:00 UTC
🎯 The single closest forecast wins 5 USDT (based on Binance spot price)
📌 One entry/day
📸 Screenshots from CoinAnk are required!
#Crypto #BitcoinChallenge #Airdrop #BTCForecast


TradingClubBTC retweeted

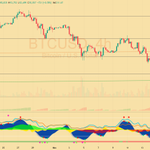
The current price of Bitcoin is around 79,013 USDT approaching a critical resistance level at 80,357 USDT (the 1.272 Fibonacci extension) 📊, which could prove to be a significant barrier for further upside movement 📈. Analysis of the Trading Cipher X (TCX) indicator shows that bullish momentum is still dominant 🔥, yet subtle signals are emerging that might hint at a potential correction ⚠️.
The Momentum Waves on TCX are exhibiting strong upward movement 🚀, but they're nearing a point where a red dot appears above the wave 🛑 – often interpreted as a signal that the trend could be peaking. This suggests that the market might soon slow down or correct, especially as it nears this strong resistance level. Supporting this momentum, the Money Flow Wave remains positive (green) 💚, indicating continued capital inflow and reinforcing bullish pressure 📈. However, there is a slight downward curvature in Money Flow, which could be an early sign of weakening demand. If Bitcoin fails to break through the 80,357 USDT resistance, this dip in Money Flow could indicate a shift where buyers start losing strength 🤔.
The VWAP (Volume Weighted Average Price) Momentum Wave also remains in positive territory, but it’s starting to show minor signs of weakening 📉, suggesting some investors might be ready to take profits 💵. If the VWAP Momentum dips below the zero line, this would be a stronger signal of a potential correction 🚨.
Looking at Trigger Lines, they are positioned near the peak of the Momentum Wave, signaling an approaching decision point 🕒. Trigger Lines often act as a barometer for further price movement; if they flip, it can indicate an impending correction 🔄. Altogether, these indicators suggest that while there’s strong upward momentum, the market is in a high-risk zone for a correction around the 80,357 USDT level.
If Bitcoin manages to break through this resistance, it could pave the way for further gains toward the next target of 83,858 USDT 🚀. However, if resistance holds, a pullback toward support at 73,650 USDT becomes more likely. For traders, it’s crucial now to closely monitor VWAP and further signals from TCX, like Money Flow and Trigger Lines, as these will reveal whether buyers will keep control or if we’re likely to see a correction ⚖️.
#BTCUSDT $BTC #BTC #BTCUSD #Bitcoin #Crypto #TradingAnalysis #Fibonacci #TradingCipherX #CryptoMarket #CryptoTrading #BTCResistance #CryptoMomentum 🚀📉📊


TradingClubBTC retweeted
Amount of technical analysis experts who sell dreams on X is terrifying. They promise mountains of gold and profits of several hundred percent. In reality, they are tricking you into affiliates on cryptocurrency exchanges.
The truth is that most people lose on the Crypto market.
One more thing... the only thing we can be sure of is that the #cryptocurrency market will surprise us again.
TradingClubBTC retweeted

$BTC Plan i’am looking for the next weeks.
Bounce here, get everyone bullish calling again for the 8976th bottom and then hard sell off to $47/44k where I would expect a strong bounce back to ATH.
Reclaim $64k and we can talk about longing again but until then $47k is the way 🙏🏻

TradingClubBTC retweeted
#Bitcoin is currently holding around $57,988, and the market seems to be balancing on key Fibo retracement levels. There are a few things to keep an eye on here. The 0.382 level at $59,045 is a crucial resistance that the price needs to break if we’re going higher. On the downside, support at $57,174 (the 0.5 retracement) is holding the market from further decline.
Looking at Trading Cipher X, I see momentum still in oversold territory, but the green dots give some hope for a bounce. Money Flow Wave is in the green, meaning money is flowing into the market, so the bulls have a chance to maintain the price around these levels. VWAP has crossed up, confirming the bullish sentiment, so we might see an attempt to break through the $59,000 level.
However, if the price drops below $57,000, we could see a fall toward $55,000, as that's the next support at the 0.618 Fibonacci level. But if the price starts climbing and breaks above $59,000, we could be looking at $61,000–$62,000 in the next few days.
In short — $57,174 is the key support, and $59,045 is the resistance. A break of either will determine where we head next.

TradingClubBTC retweeted
#Bitcoin continues to drop. However, as I mentioned here before, this is not the end. Soon, we might see the price around $55K. This isn't the end of bad news... 😈 It's also possible that it could drop to $50K, either this weekend or the next.
Trading Cipher X (the best indicator) is signaling that money flow is weakening and momentum is losing strength.
All of this makes me almost certain that we will see the price levels I mentioned above.
The key Fibonacci levels to watch right now are 0.618 on the small Fibonacci retracement and 0.382 on the large Fibonacci retracement. #BTCUSDT


