

TradingView indicators & more👇
Joined March 2021
- Tweets16K
- Following334
- Followers40.5K
- Likes39.6K



Pinned Tweet
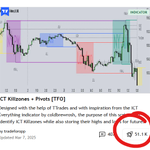
Killzones & Pivots 50k Update - biggest update since initial release🧵
TLDR:
- 6 killzones (+1 from 5)
- New range levels based on session data
- Previous D/W/M midlines + overlapping label fix
- Table rework + hit rate statistics
- Unlimited open prices (was 8)
- Unlimited timestamps (was 4)
More details below - save & share if helpful👇

👇👇

Poll for the killzones update:
Option 1: restore the old version
Option 2: keep the new one
Many are still confused about the new update and asking for the old one back
If option 1 wins, I'll just publish the new version as a completely separate "v2" indicator
60%Restore the old version
40%Keep the new one
48 votes • Final resultsPoll for the killzones update:
Option 1: restore the old version
Option 2: keep the new one
Many are still confused about the new update and asking for the old one back
If option 1 wins, I'll just publish the new version as a completely separate "v2" indicator
60%Restore the old version
40%Keep the new one
48 votes • Final results⚠️READ THE TOOLTIPS⚠️
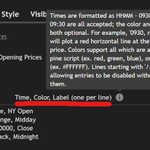
The old version had a "True Day Open" anchored at midnight. To get this back as a black line, just type:
00:00, black, True Day Open
I literally labeled it with instructions (Time, Color, Label)
Timestamps are the same, just no label:
00:00, black
I promise every question I've been asked about this update has an answer in its corresponding tooltip


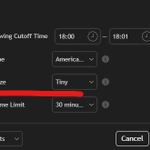
There's a 6th killzone slot now — preset to RTH (0930-1600). Turn it on to track the full session's high/low/range alongside your intraday killzones, with all the same pivots, levels, and stats.

⚠️ The settings menu was completely rebuilt, so your saved settings will likely reset — you'll need to re-enter opening prices and timestamps in the new format.
A lot was changed, so please report any lingering issues and I'll happily take a look
Update is live on TradingView. Full release notes in the description here: tradingview.com/script/nW5oG…


Fixing this - has been a common ask for a long time
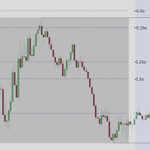
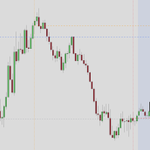
Overlapping seems most relevant to D/W/M levels (ex. NQ Sunday night weekly open = Monday daily open)
Other labels not as relevant imo (pivots, open prices), but if needed I'm sure we can make another update


#10 all time on TradingView
Thank you to the 50k+ who have supported this
Working on an update - I have some ideas already, but feel free to share your thoughts


Trade For Opportunity retweeted
Killzones & Pivots is now the #10 most boosted indicator on TV
In anticipation of hitting 50k, what updates you would like to see most?
Thinking of adding some basic stats showing how often levels get hit (will attach an example below)

Killzones & Pivots is now the #10 most boosted indicator on TV
In anticipation of hitting 50k, what updates you would like to see most?
Thinking of adding some basic stats showing how often levels get hit (will attach an example below)
Stats example that I built into a separate indicator: xitter.cf/TradeForOpp/status/183…
idea to show which of the last 5 days raided a session high, low, or both
🟩 = yes, 🟥 = no
ex. Asia high gets traded through 92% of the time on this NQ chart. yesterday this didn't happen (🟥), so perhaps there was a higher % chance of doing so today (🟩)
100% inspired by @Austin_Clark_YT talking about how, if there's ~70% probability of retracing to midnight open during a given time window, and it doesn't happen one day, it's even more likely to happen the next day. the numbers need to balance themselves out eventually
something I'm def interested to expand on

NQ, ES, & YM: breakout days & targets
This report takes the initial balance, draws extensions from its range, and shows how often price hits those extension levels
Ex. the "+1.0" extension for a given day would be evaluated as:
ib_high + [(ib_high - ib_low) * 1.0]
Negative numbered extensions are similar but drawn from the range low, ex. "-0.5" would be:
ib_low - [(ib_high - ib_low) * 0.5]
With today being considered a breakout day on NQ, ES, and YM (confirmed with price only trading above the IB high, never below the IB low), here are the probabilities of a few extensions from these IB ranges
NQ (3 year lookback):
+0.2: 87.54%🔵🔵🔵🔵🔵
+0.4: 70.29%🔵🔵🔵🔵
+0.6: 52.08%🔵🔵🔵
+0.8: 36.1%🔵🔵
+1.0: 25.24%🔵
ES (3 year lookback):
+0.2: 92.2%🔵🔵🔵🔵🔵
+0.4: 77.66%🔵🔵🔵🔵
+0.6: 60.64%🔵🔵🔵
+0.8: 52.42%🔵🔵
+1.0: 39.36%🔵
YM (3 year lookback):
+0.2: 86.25%🔵🔵🔵🔵🔵
+0.4: 69.07%🔵🔵🔵🔵
+0.6: 51.2%🔵🔵🔵
+0.8: 40.21%🔵🔵
+1.0: 29.21%🔵
Another couple notes regarding these breakout days:
1. They are validated with a wick criteria; all price has to do is wick through the IB high to be considered a breakout day, OR wick through the IB low for a breakdown day
2. If price ever wicks through both the IB high *and* the IB low - at any point throughout RTH session (the time window I'm using for this report) - that reclassifies the breakout/breakdown day as a double break day. Double break days have completely different data attached to these levels
The attached chart is an example of how these extension targets get hit across *all* days on NQ - breakout, breakdown, and double break

Any questions about reports/timeframes etc. feel free to lmk - DMs are open, replies are on "verified only" bc of bots
Try Edgeful for free: edgeful.com/?via=tfo
