
Founder - Inside Edge Capital. 13-year CNBC contributor. Wealth management, active portfolio management, financial planning, former hedge fund trader.
Saratoga Springs, NY
Joined February 2009
- Tweets21.2K
- Following1.2K
- Followers27.2K
- Likes10K

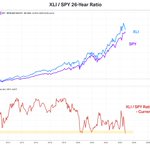


Despite the massive AI buildout in industrials as well as defense names, I'm sitting here trying to amazed that XLI could be potentially breaking to a 26-year ratio support level vs the S&P 500.

Here are your top-10 industry group winners and losers. Brewers and Distillers & Vintners in the top four. Heavy electrical industrial, components and semi materials and equipment in the top four losers. Pretty sharp rotation for sure.

Well done here Mo. You make me proud! Good work here on SMH, keeping this in my back pocket. 🙌🤘🚀🫡

Here’s another one.
$SPX and $SMH, two different instruments, both reaching that same 100% Fibonacci relationship in their larger wave structures.
This SMH count goes back nearly two decades.
Meanwhile, everyone on X is busy calling the next market top or crash. Keeps them entertained I guess. 😂
Corrections come and go. I prefer to follow the structure and let price do the talking.
Long-term investor’s roadmap, not a day trader’s chart.
Welp, here we are 3 years later, 70% higher in the S&P, and targets achieved. We need to figure out what's next!
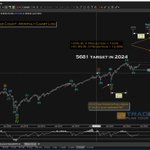
Stop using Elliott Wave for Evil! Here Is the long-term #ElliottWave count for the S&P 500, our target of 5681 in 2024, and beyond!
$LLY higher by 4.23% in an ugly tape, pending breakout above $1300. We took our holding in $LLY from 2% to 4% last week, not afraid of adding a bit more should tech continue to sell-off

Related: Healthcare relative to the S&P is coming off a 25-year low. Spoke about this recently on CNBC. Recently increased allocations in our healthcare holdings in $HALO, $LLY, $ABBV and $GH

Rotation to value has not just arrived in October, it's been here since June.
Only three sectors are making relative highs against the S&P since then: financials, healthcare, energy. Staples are above that June 2nd low also, but have not made higher lows in October like the other three.

Look forward to being on Pre-Market Prep with the boys @Spus @TripleDTrader right now! youtube.com/watch?v=o9OWsUz1…
E.G.,, we have to up our game here at Inside Edge Capital with parking spots for our clients 😆 Rockefeller and Goldman beating us out :-) Kidding aside, this awesome small town of Saratoga Springs is so saturated with wealth managers.
Yikes Ry-D! Thanks. Any chance you zoom out a bit to get more context, say 1 year? Obviously SpaceX will be limited.


Good example of quality wave analysis. We're seeing the same thing!
$SPX
On October 6, I shared an alternate Expanded Flat count showing the risk of a reversal.
October 16. SPX rejected the 7,843 area, and here we are.
Now everyone is panicking after one rough week.
Folks, corrections are part of every bull market. They unfold through price, time, or both. Not every selloff means the bull market is over.
The Daily is flashing SELL. Respect it. Let the correction unfold and wait for confirmation.
This wave count is a roadmap, not a guarantee.
I've been through enough market cycles to know that panic rarely makes anyone money.
Control your emotions. Protect your capital. Have some patience.
The market isn't going anywhere. Opportunities will come again.
$SPY $QQQ


Well said @fedmarket_ . I appreciate the kind words of support. You're right, I tend to take a glass half full approach to the markets, ditto with wave analysis. But you're right, I'm seeing the possible wave structures suggesting a larger decline is possible. I've spent 2 decades+ learning to reinforce the technical assessment with macro, rotation, and a fundamental analysis to filer the various possible counts. And you're right, I'm seeing evidence in here that some of counts with fangs are creeping towards the front of the pack.
Cue in our old buddy @eWavePilot - you around brother??

Hey Todd, I’ve been following you for years and one thing I’ve always admired about your Elliott Wave analysis is your ability to stay calm and let the counts speak for themselves.
Recently, a few of us who follow Elliott Wave closely started noticing some really bearish counts developing. We kept saying man, the market is screaming something here.
And I kept watching your posts thinking at some point Todd is going to recognize what these counts are suggesting. And I think you’re finally seeing it too.
The scary part is that this might not be just another correction. If the decline starts unfolding as an impulsive wave rather than a corrective structure, we could be looking at something much bigger and potentially much uglier.
Sometimes you just have to let the waves do the talking.
Was on @CNBC this week talking healthcare. Did you know XLV is now in the bronze medal position on sector YTD% behind energy and tech? Standout stock we hold is HALO with dynamite numbers from @IBDinvestors @marketsurge
✅99 Comp
✅94 EPS Rating
✅A+ Acc/Dis
✅108% EPS growth
✅30% Sales growth
Broke out on 2 days of above 50-day average volume

And for those Elliott Wavers out there, we dusted off the old corrective playbook. In the $NDX100 $QQQ we see 3-waves down from June, 3-waves up from July, which leaves either a flat or triangle correction in play resulting in further chop, lower market prices. If I'm wrong, FINE, I'll take that 13% chunk and re-deploy for the next move higher.


Risk management move today: we cut 13.5% of AI-related exposure ($DDOG $LITE $NBIS $SMTC $FORM $AMD $RKLB) and reallocated to energy ($APA $COP), healthcare ($LLY $HALO), T-bills ($BIL), and a 5% inverse Nasdaq hedge ($PSQ).
This isn’t a verdict on AI long term. These were recent adds showing capital losses, so cutting them reduces risk and harvests losses we can use against gains later this quarter. Risk management is key when trading the hard right edge of the chart and unknown future.

Full video details on this portfolio update here: youtube.com/watch?v=D9DrtZTq…

Risk management move today: we cut 13.5% of AI-related exposure ($DDOG $LITE $NBIS $SMTC $FORM $AMD $RKLB) and reallocated to energy ($APA $COP), healthcare ($LLY $HALO), T-bills ($BIL), and a 5% inverse Nasdaq hedge ($PSQ).
This isn’t a verdict on AI long term. These were recent adds showing capital losses, so cutting them reduces risk and harvests losses we can use against gains later this quarter. Risk management is key when trading the hard right edge of the chart and unknown future.

