

Structural reads on power, data and science — what the headline number leaves out, and the precedent that explains it.
- Tweets536
- Following116
- Followers42
- Likes41



ALT A dark portrait infographic titled "Africa's record solar year — three-quarters of it uncounted." Kicker: Africa, solar, Ember, 27 August 2026. The hero figure is 17 GW — new solar installed across Africa in 2026, a continental record, up 45% on 2025, described as Ember's estimate modelled from Chinese customs data rather than meters. A band headed THE SIX GIGAWATT MARKETS, 2026 gives six horizontal bars proportional to their values: South Africa 3.3 GW, the longest; Egypt 2.0 GW; Nigeria 1.7 GW; DR Congo 1.7 GW, the same length as Nigeria's; Algeria 1.4 GW; and Morocco 1.0 GW. A band headed "How much solar did Africa install in 2025?" gives three different answers from three institutions: Ember, 12.0 GW; the International Energy Agency, 6.2 GW; the International Renewable Energy Agency, 4.6 GW. A highlighted box headed THE PART NO ONE COUNTS reads 20 GW of 26 GW — of all solar capacity Africa added between 2023 and 2025, that share was distributed rooftop-and-yard systems, describe


ALT The Reframe ledger card, dark serif on space-black. Hero stat: 50% non-fossil capacity — the 2030 pledge, hit five years early. 288.6 GW renewable capacity in June, solar alone at 162 GW. 29 GW record solar and wind added in H1 2026. The floor, not the ceiling: India pledged 40% non-fossil capacity at Paris, then raised it to 50% in 2022. It crossed the harder line in 2025, five years early — though capacity is not yet delivery; the wires are racing to catch up.

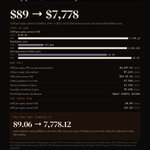
ALT A dark portrait infographic, number 002 in the series, titled "Sixty years, measured by the same instrument." Kicker: Botswana, 1966 to 2025, one source both ends. The hero figure is $89 to $7,778 — GDP per capita in current US dollars, an 87-fold increase on one continuous World Bank series. A band headed THEN VS NOW gives three paired horizontal bars, 1966 in muted lilac above the present in cream, each pair scaled to the larger value. GDP per capita, current US dollars: 89.06 in 1966, rendered as a bare stub, against 7,778.12 now. Population: 577,866 against 2,562,122. Life expectancy at birth: 54.36 years against 69.29. A band headed NOW ONLY lists seven present-day figures with the year each refers to: GDP per capita at purchasing power parity, 20,697.91 international dollars (2025); GNI per capita, Atlas method, $7,610 (2024); total GDP, $19.93 billion (2025); urban population, 67.96% of the total (2025); tertiary enrolment, 21.41% gross (2024); secondary enrolment, 70.63% gros

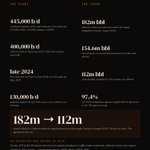
ALT The Reframe ledger card, cream serif type on space-black. Heading in copper: THE LEDGER — THE CONSTRAINT MOVED. Sub-kicker: Nigeria, from the plant to the terms, 2023 to 2026. Two columns divided by a hairline. The left column, headed THE PLANT: 445,000 barrels a day, the combined capacity of the state refineries — Port Harcourt 210,000, Warri 125,000, Kaduna 110,000; 400,000 barrels a day of refined products imported in 2023 while that capacity stood idle; late 2024, when Port Harcourt and Warri restarted, both shut again by May 2025; and 130,000 barrels a day of seaborne imports by the second quarter of 2026, once a new refinery was running. The right column, headed THE TERMS: 182 million barrels offered to domestic refineries under the supply obligation between January and August 2026; 154.6 million barrels, the refineries' own declared requirement for the same period; 112 million barrels of deals actually completed, 61% of what was offered; and 97.4% compliance in the second quarte

ALT A dark portrait infographic titled "The law obliges an offer. It does not oblige a deal," on Nigeria's Domestic Crude Supply Obligation, January to August 2026. The hero figure reads 182 million to 112 million: barrels of crude offered to Nigeria's domestic refineries against barrels for which deals were actually completed. Three horizontal bars, proportional to their values, compare the same eight months — Offered, 182 million barrels, the longest bar; Declared need, 154.6 million barrels; and Completed, 112 million barrels, the shortest, its label picked out in copper. A second band gives quarterly supply as the regulator reported it: 28.5 million barrels supplied to local refineries in the first quarter of 2026 against 61.9 million barrels allocated in the same quarter, then 53.7 million barrels supplied in the second quarter at a compliance rate of 97.4%. A further band lists what the regulator says the gap is — pricing, payment guarantees, specifications and delivery schedules — n

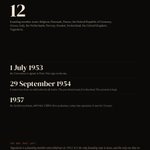
ALT The Reframe ledger card, cream serif type on space-black. Heading: THE LEDGER — TWELVE GOVERNMENTS, ONE MACHINE. Sub-kicker: CERN, Convention in force 29 September 1954. The hero figure is 12 — the founding member states: Belgium, Denmark, France, the Federal Republic of Germany, Greece, Italy, the Netherlands, Norway, Sweden, Switzerland, the United Kingdom and Yugoslavia. Three dated entries follow: 1 July 1953, the Convention is signed in Paris, nine signing on the day; 29 September 1954, it enters into force on ratification by all twelve; 1957, the Synchrocyclotron comes into operation and runs for 33 years. Under the label THE ONE THAT LEFT: Yugoslavia is a founding member and withdraws in 1961, the only founding state to leave and the only one that no longer exists. Byline lower left, Rahul Krishnan, @The_ReFrame_.

ALT Dark serif ledger card on space-black, headed "The Ledger — Stakes & Pattern." Hero figure in copper: 10 of 27, labelled "EU member states that have never ratified CETA." Two supporting figures: ~90% in cream, "of CETA in force provisionally since 2017"; and July 2020 in brick-red, "Cyprus voted no; it continued." Beneath the divider, under the heading "The 1992 precedent": "Switzerland refused the bloc by 50.3% in 1992 and took a side entrance instead — it signed the agreement tidying that arrangement in March 2026, thirty-four years on," with 50.3% picked out in brick-red. Signed Rahul Krishnan above the handle @The_ReFrame_. Typography only, no imagery.

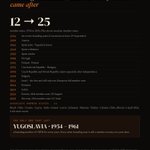
ALT A dark portrait infographic titled "Twelve governments, and then everyone who came after," tracing CERN's membership from twelve founding states in 1954 to twenty-five today. A vertical timeline lists each accession by year: Austria 1959, Spain 1961 and again 1983 after withdrawing in 1969, Portugal 1985, Finland and Poland 1991, Czechoslovak Republic and Hungary 1992, the Czech and Slovak Republics rejoining separately in 1993, Bulgaria 1999, Israel 2014 as the first non-European member, Romania 2016, Serbia 2019, Estonia 2024 and Slovenia 2025. A further band lists the eleven associate member states. A highlighted box marks Yugoslavia, a founding member from 1954 until it left in 1961 — the only founding state to leave. Byline lower left, Rahul Krishnan, @The_ReFrame_.

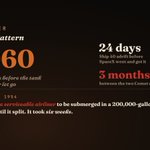
ALT The Reframe ledger card, dark serif type on space black. THE LEDGER — Stakes and Pattern. Hero figure in copper: 3,060 pressure cycles before the tank fuselage finally let go. Two supporting figures to the right: 24 days in cream, Ship 40 adrift before SpaceX went and got it; and 3 months in brick red, between the two Comet crashes. Below a divider, under FARNBOROUGH, 1954: BOAC gave up a serviceable airliner to be submerged in a 200,000-gallon tank and pressurised until it split. It took six weeks. Byline Rahul Krishnan above the handle @The_ReFrame_, and a SOURCE mark bottom right.


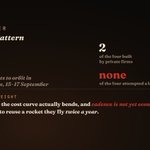
ALT The Reframe ledger card, cream and copper on space black. THE LEDGER — Stakes and Pattern. Hero figure in copper: 4, different rockets to orbit in forty-five hours, 15 to 17 September. Two supporting figures to the right: 2 in cream, of the four built by private firms; and none, in brick red, of the four attempted a landing. Below a divider, under THE COUNTERWEIGHT: reuse is where the cost curve actually bends, and cadence is not yet economy. But nobody learns to reuse a rocket they fly twice a year. Byline Rahul Krishnan above the handle @The_ReFrame_, and a SOURCE mark bottom right.

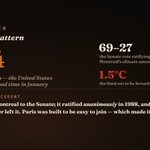
ALT The Reframe ledger card, cream and copper on space black. THE LEDGER — Stakes and Pattern. Hero figure in copper: 83 to nothing, the US Senate vote ratifying the Montreal Protocol on 14 March 1988. Two supporting figures to the right, both in brick red: 2.8 degrees Celsius, where UNEP puts current policies; and 194, parties to Paris since January. Below a divider, under THE 1987 PRECEDENT: Montreal was a treaty the Senate ratified, and the United States has stayed in it under every administration since. Paris was joined by executive action — which is why a president could leave it twice. Byline Rahul Krishnan above the handle @The_ReFrame_, and a SOURCE mark bottom right.

ALT The Reframe ledger card, dark serif on space-black. THE LEDGER — Stakes & Pattern. Hero figure in copper: 1.8°C, the best case — every current pledge delivered in full. Supporting figures: 1.5°C, shown in red, crossed within a few years; and 2.6°C, also in red, where current policies point, by 2100. Under PARIS, 12 DECEMBER 2015: the aim was to hold warming well below 2°C while pursuing 1.5 — the number was a choice, the consequences of passing it are not. SOURCE mark bottom-right. Byline Rahul Krishnan · @The_ReFrame_.

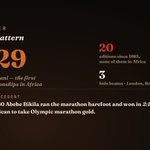
ALT The Reframe ledger card, dark serif on space-black. THE LEDGER — Stakes and Pattern. Hero in copper: 2029, Nairobi at Kasarani — the first World Athletics Championships in Africa. Supporting stats: 20, editions since 1983, none of them in Africa, shown in red; and 3, bids beaten — London, Rome and Munich. Under THE 1960 PRECEDENT: at Rome in 1960 Abebe Bikila ran the marathon barefoot and won in 2:15:16.2 — the first Black African to take Olympic marathon gold. SOURCE mark bottom right. Byline Rahul Krishnan above the handle @The_ReFrame_.


ALT Ledger card, IN FOCUS — Abebe Bikila. Hero figure: 1st, Black African Olympic champion — Rome, 1960. Side stats: 2:15:16.2, winning time — barefoot; 2×, first to win the marathon twice. A First Becomes A Lineage: His barefoot gold in Rome and his Tokyo defence made him the first man to hold two Olympic marathon crowns — and the first Black African champion, in a discipline his heirs in Ethiopia and Kenya define to this day.
